Dries Buytaert

Drupal.org site statistics

Like it or not, but with 2007 around the corner, it is almost reflections and predictions time again. With that in mind, you might find the graphs below to be a source of inspiration.
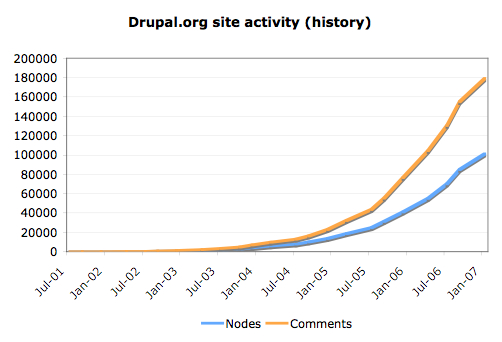
Site activity history absolute
The past growth in absolute numbers. The "January 2007"-kink is due to the fact that data for December 2006 is not yet available at this point.
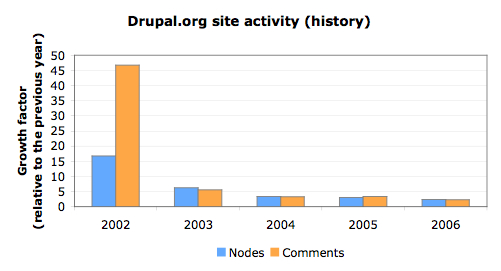
Site activity history relative
The past growth in relative numbers. In 2005, the number of nodes and comments grew by more than 300%. In 2006, the number of nodes and comments grew by more than 230%.
Site activity projections
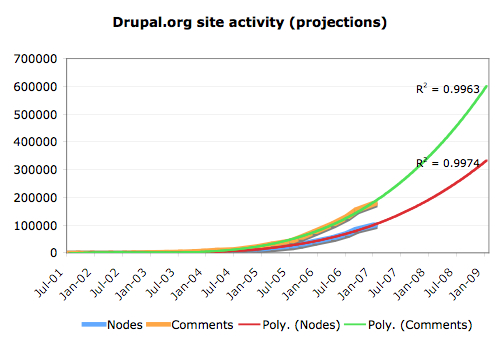
A growth projection using a polynomial fit (multiple regression). Simply put, the correlation coefficient R-square, is a measure for the quality of the fit. R-square can assume values between 0 and 1, where a value of 1 indicates a perfect fit. Bear in mind that a statistical fit may be anything but an accurate prediction of future growth.

— Dries Buytaert

11 sec read time