Drupal
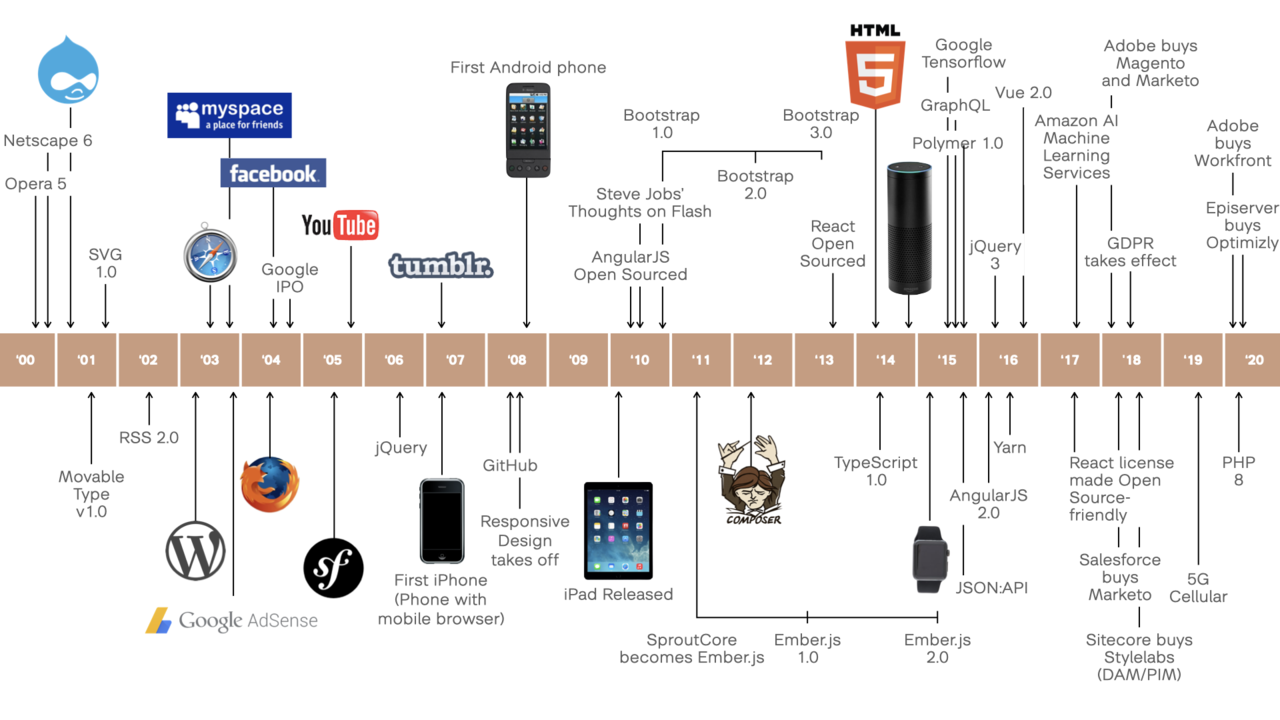 A list of technology events that came after Drupal, and that directly or indirectly impacted Drupal. To stay relevant, Drupal had to adjust to many of them.



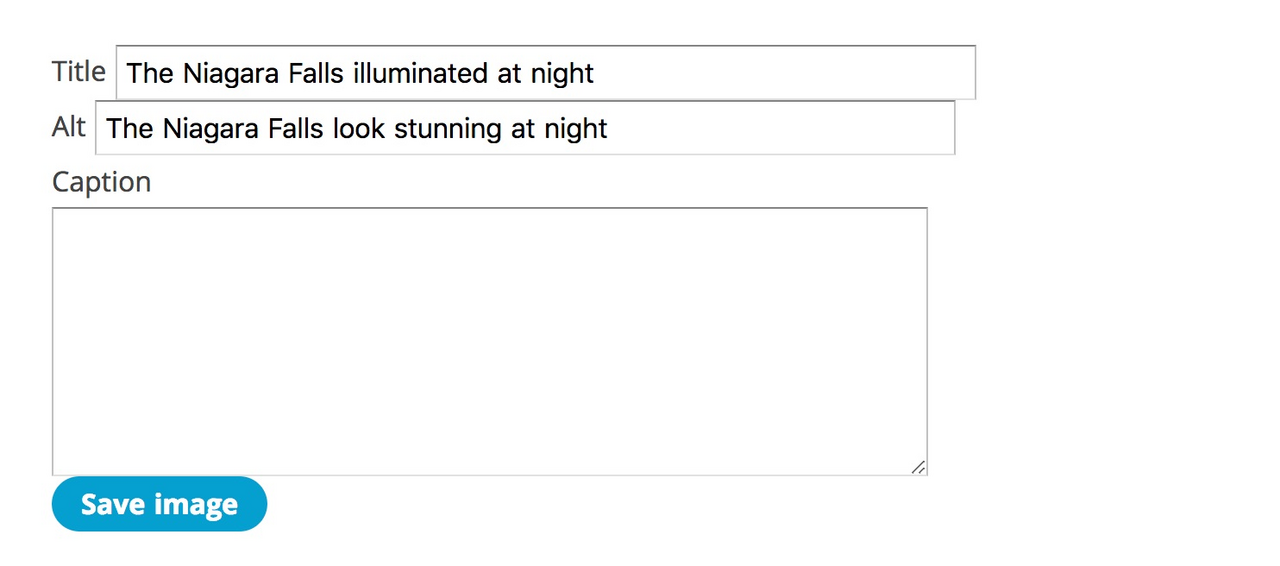
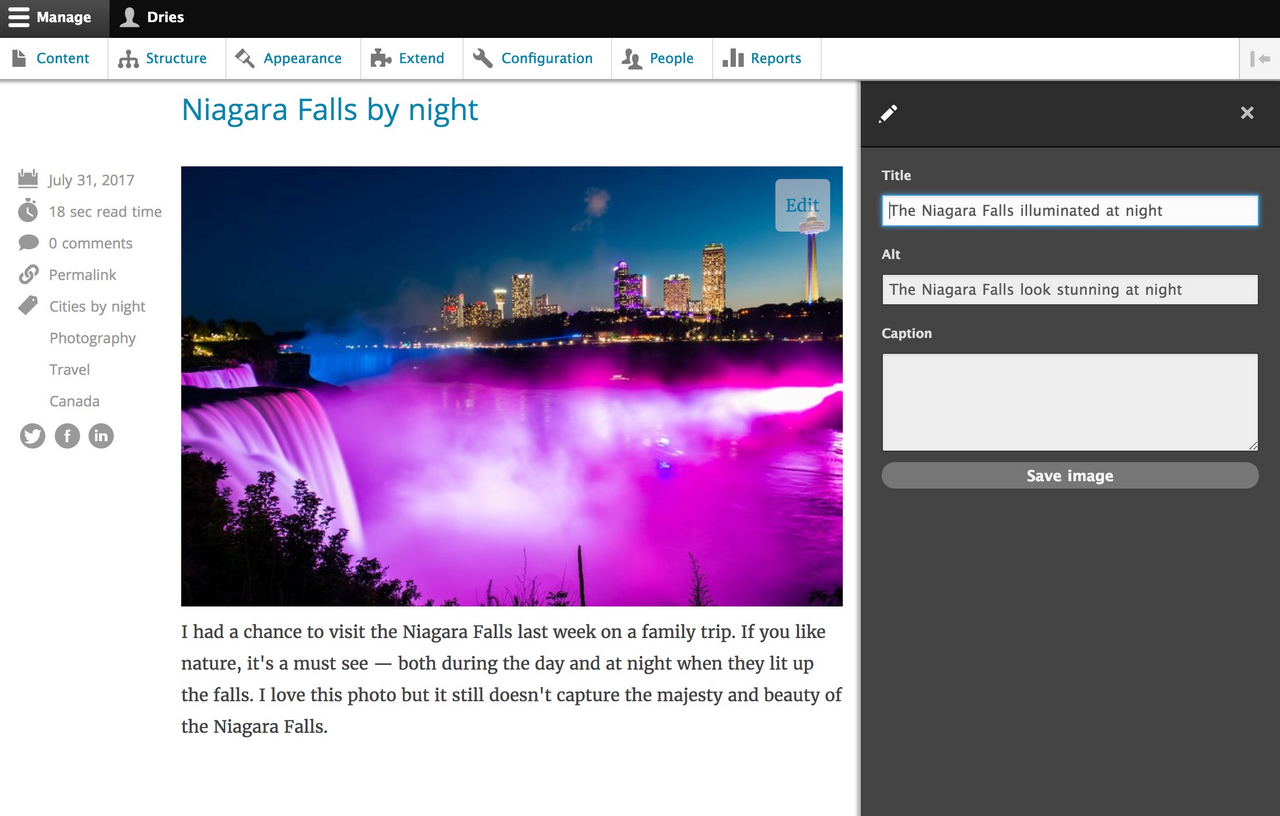
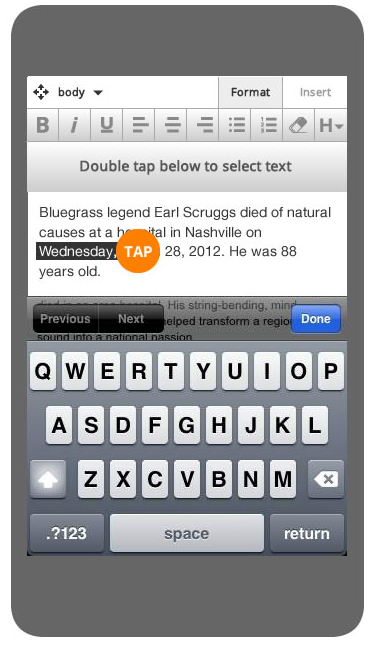 By tapping into a rich text field such as Body, a toolbar comes up with two tabs with editor buttons below: Format (containing buttons such as Bold, Italic, Left/Right Align, and Lists) and Insert (for Links, Images, and the like).

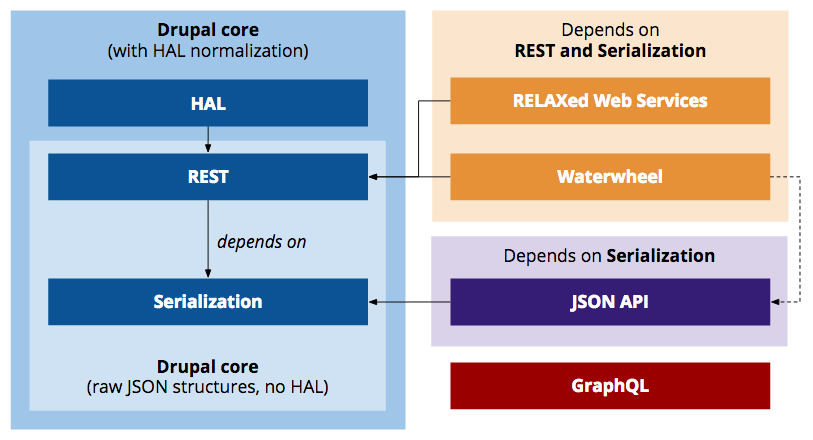 An overview of the key building blocks to create web services in Drupal. Out of the box, Drupal core can expose raw JSON structures reflecting its internal storage, or it can expose them in HAL. Note: Waterwheel has an optional dependency on JSON API if JSON API methods are invoked through Waterwheel.js.


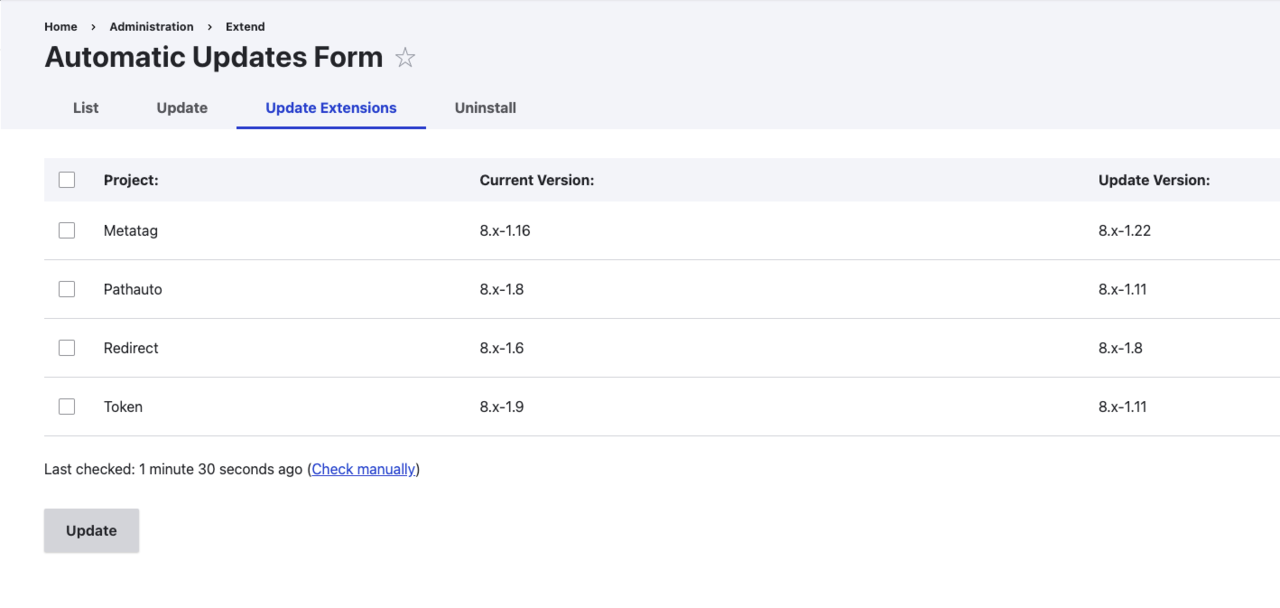 A design proposal for Automatic Updates. There are updates available for different modules. You can upgrade them immediately using the user interface, or you can let the scheduler run to do it for you.





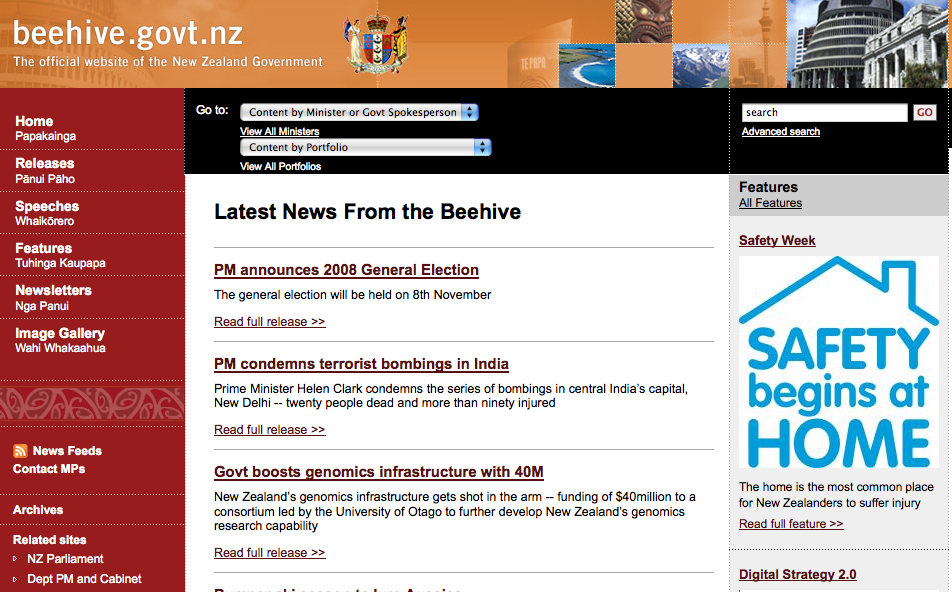
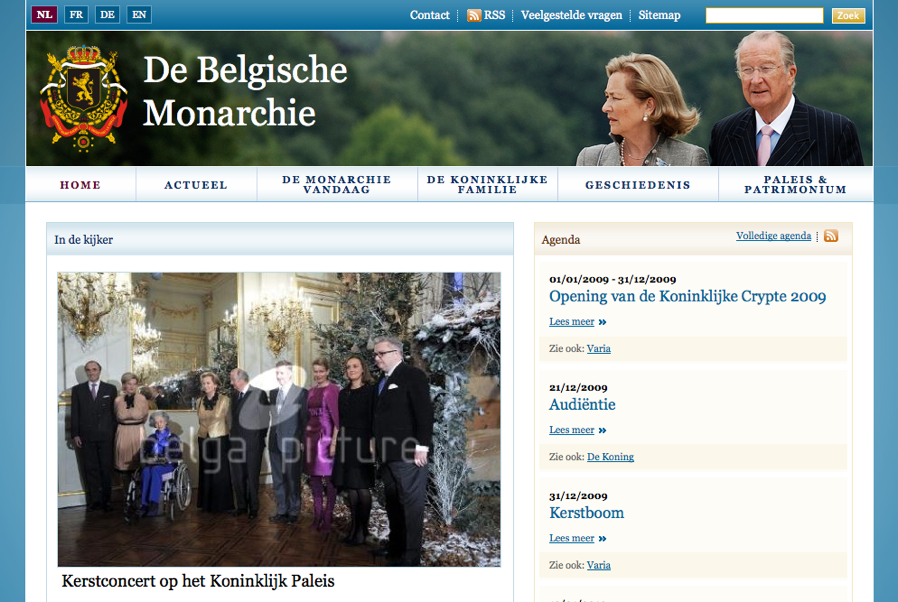
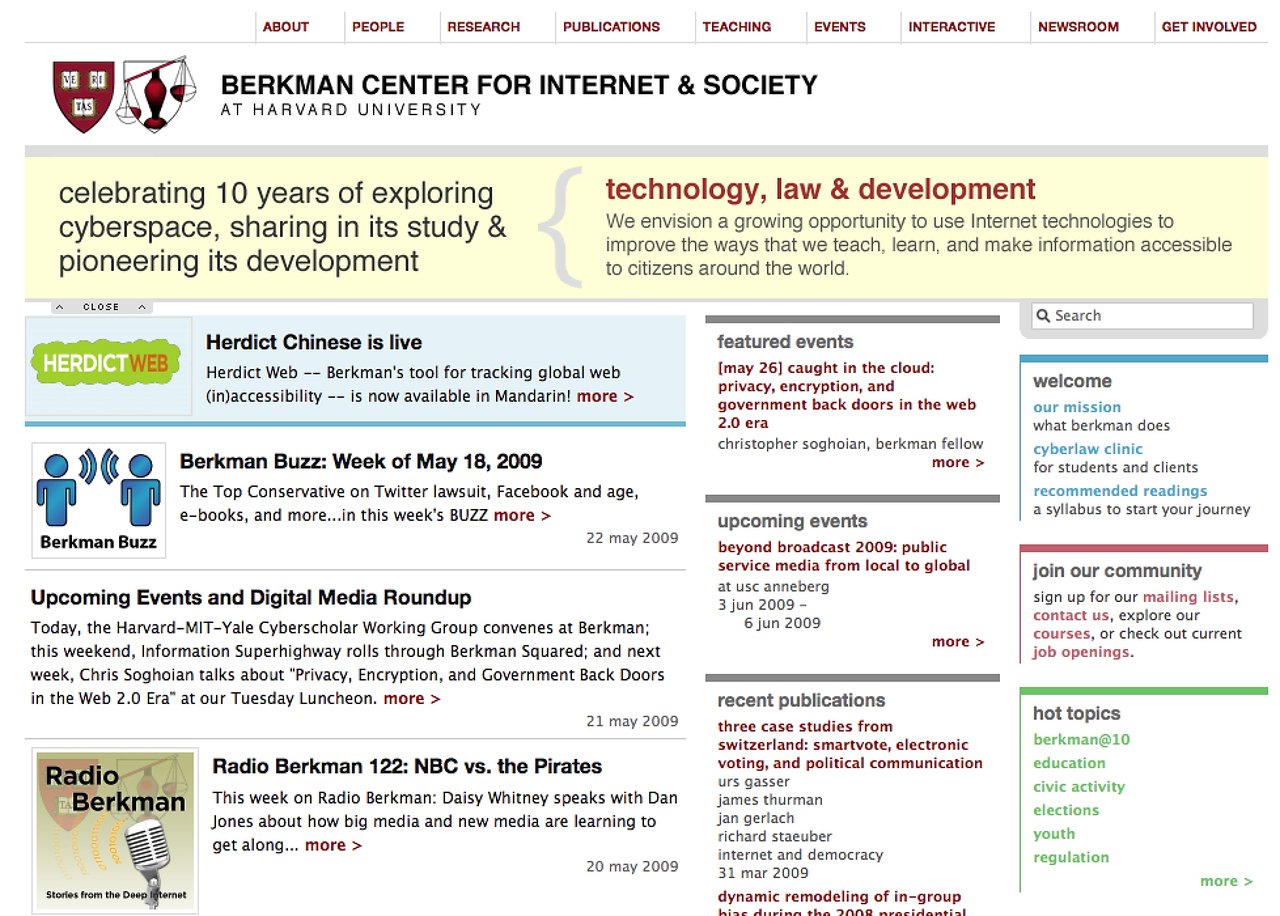

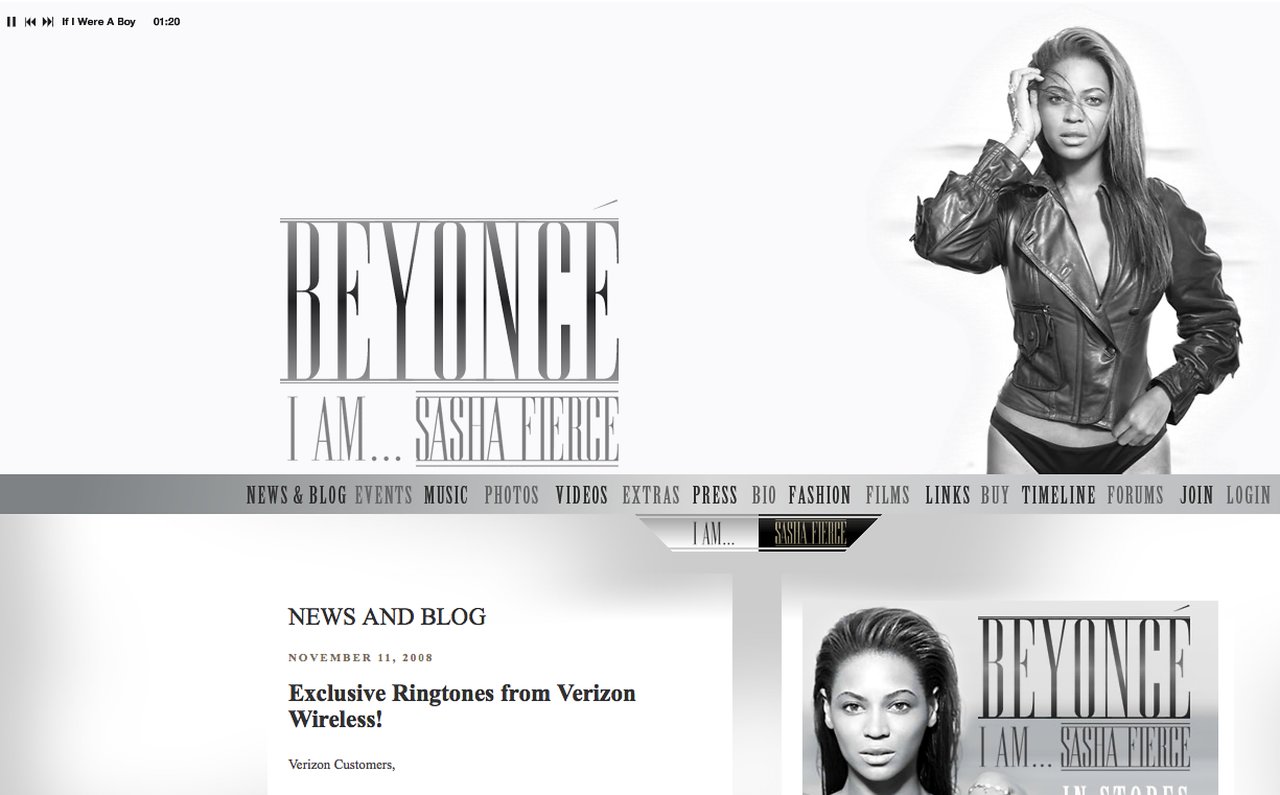



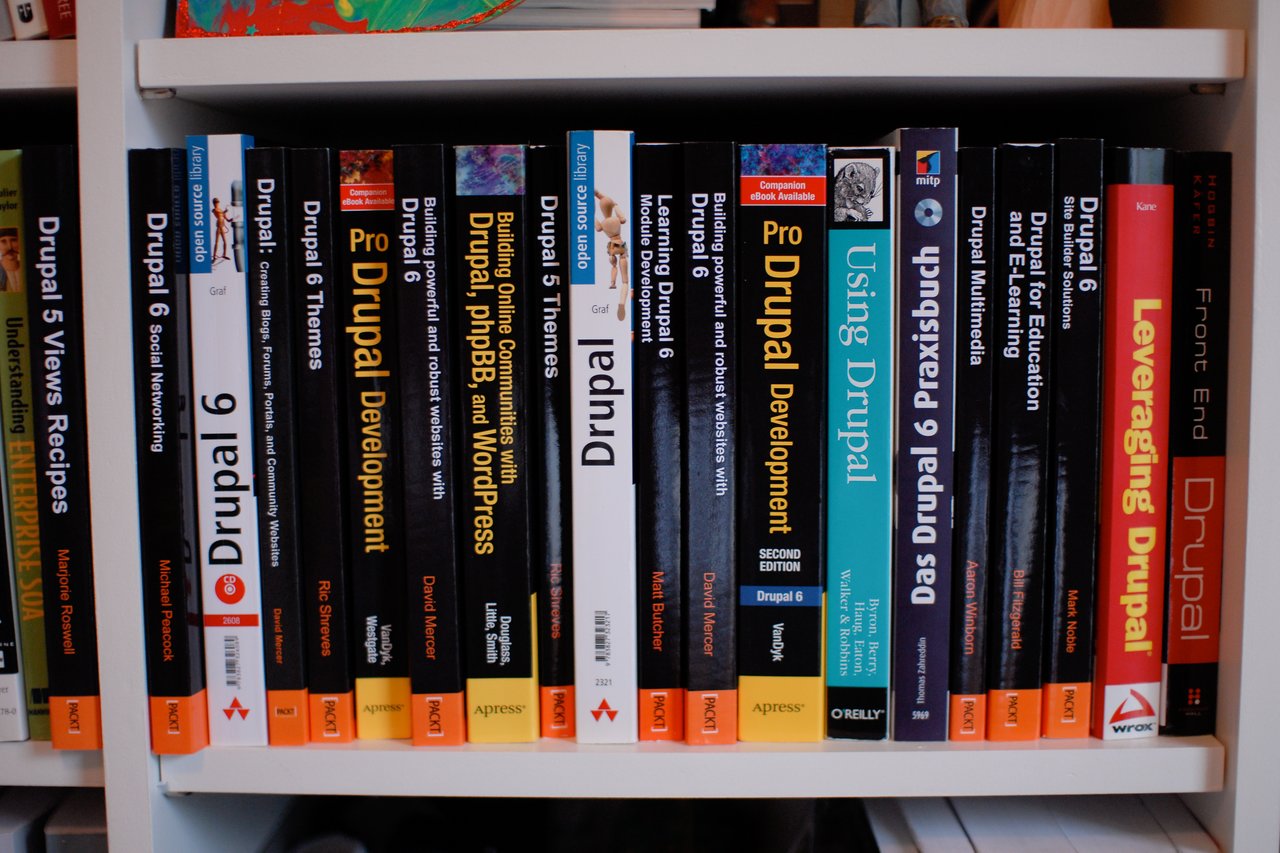
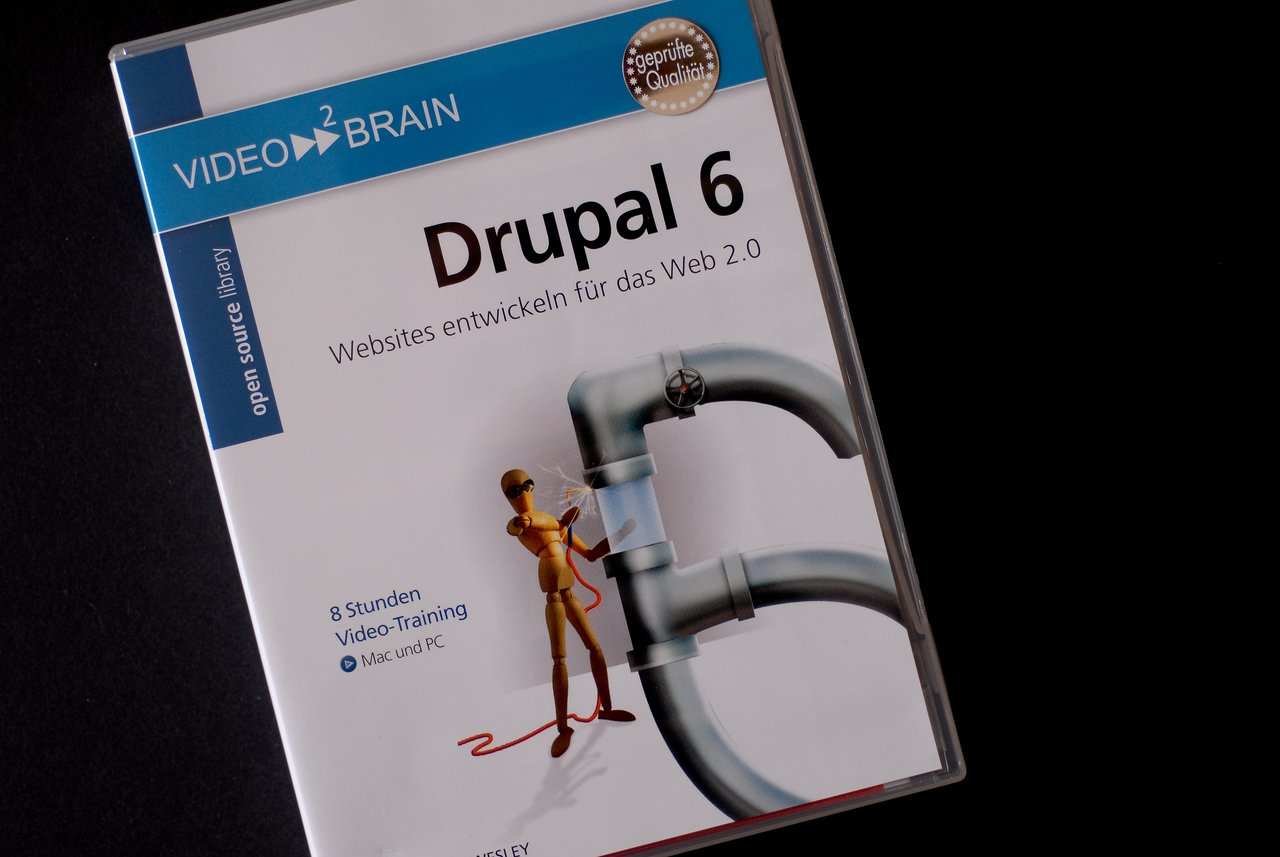
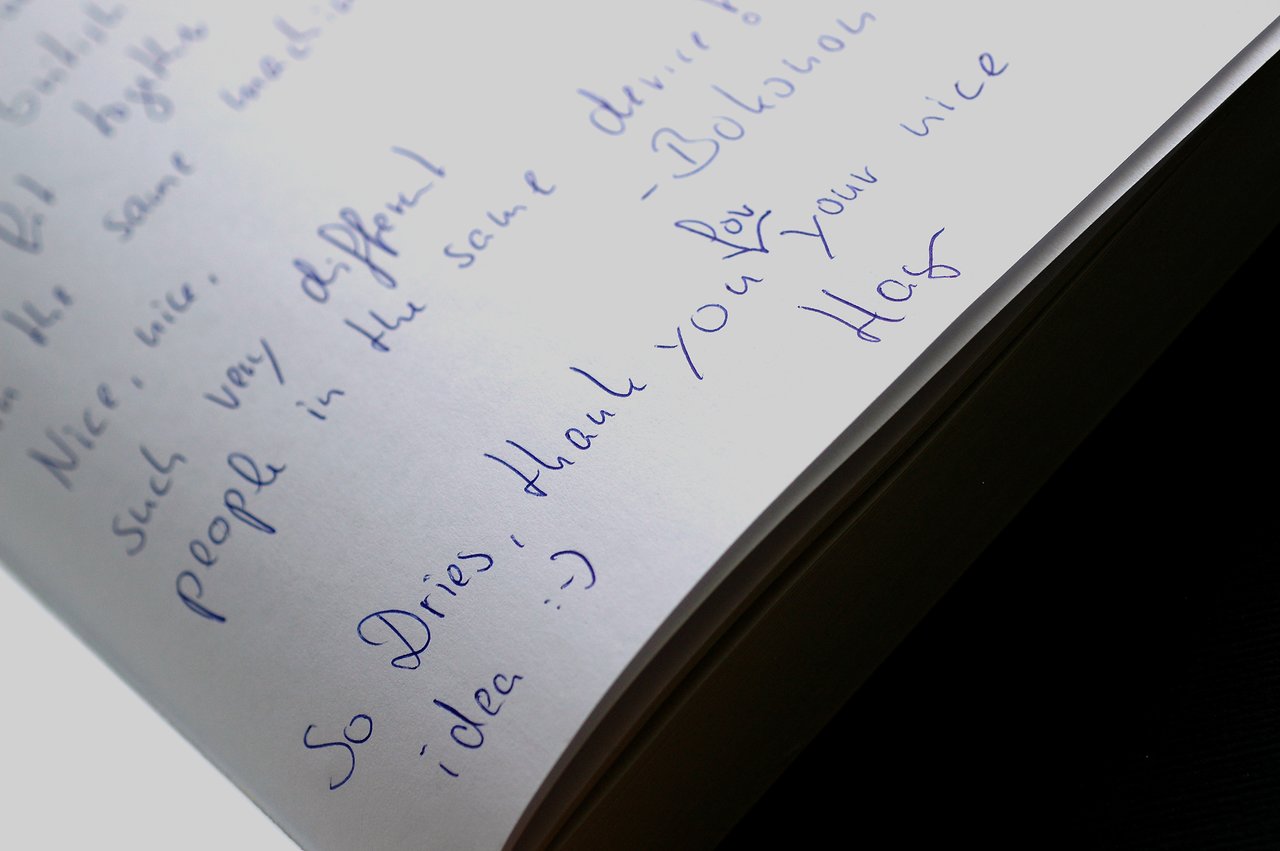
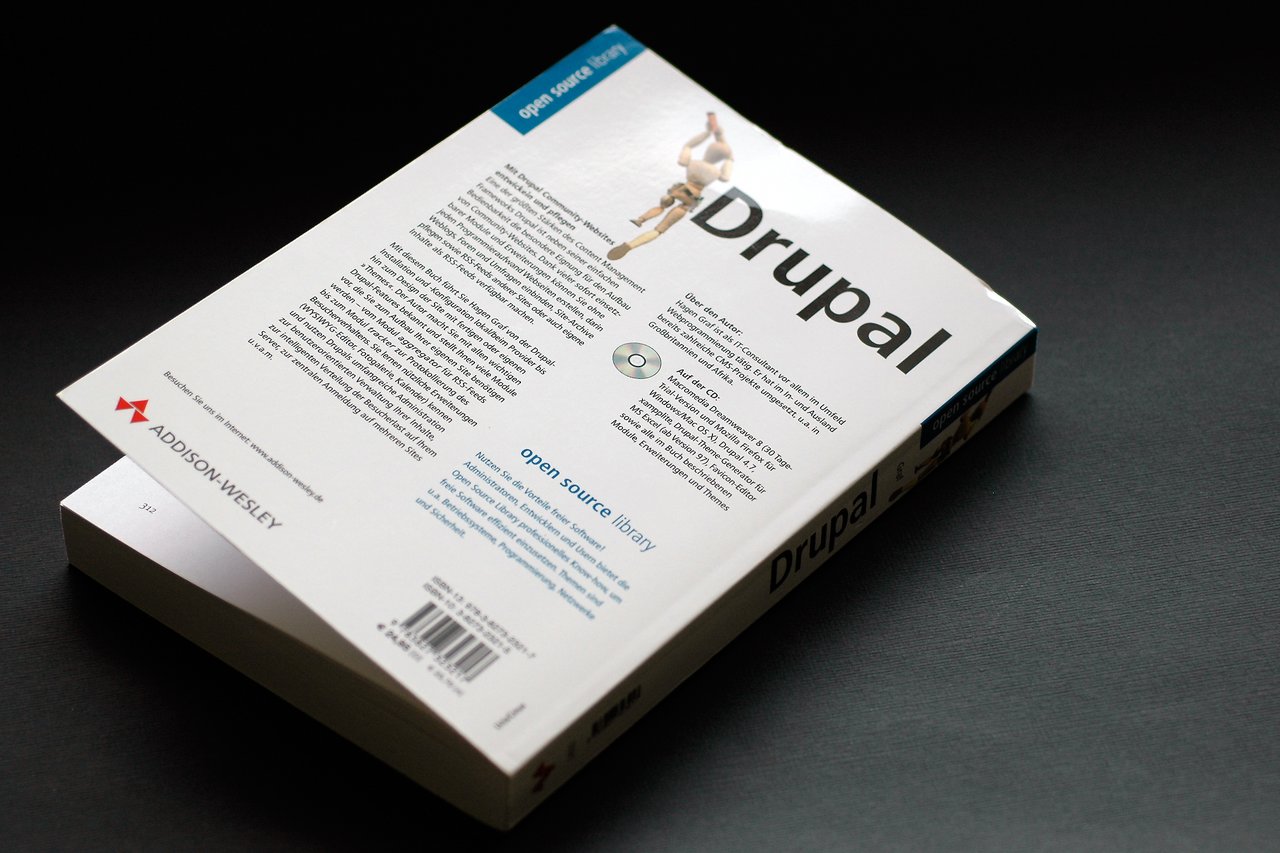
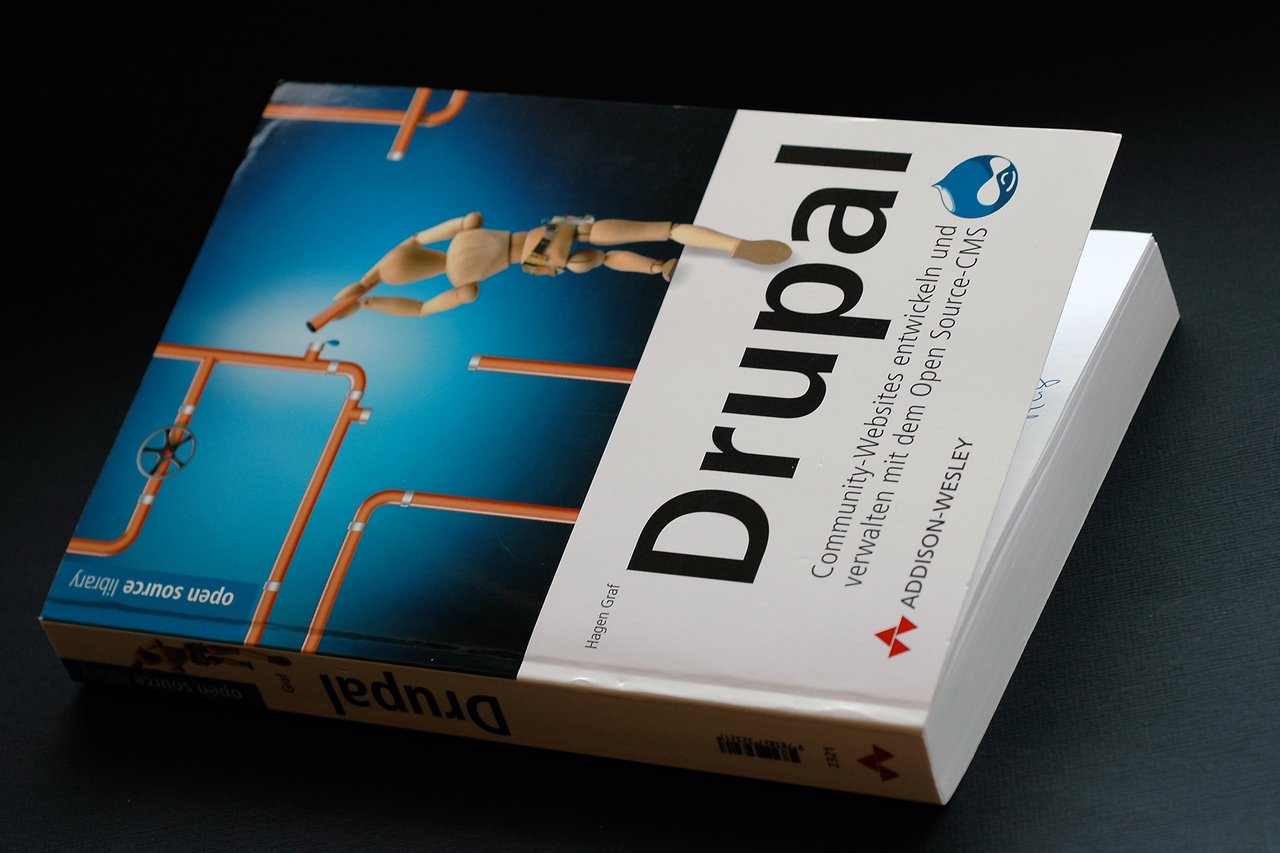
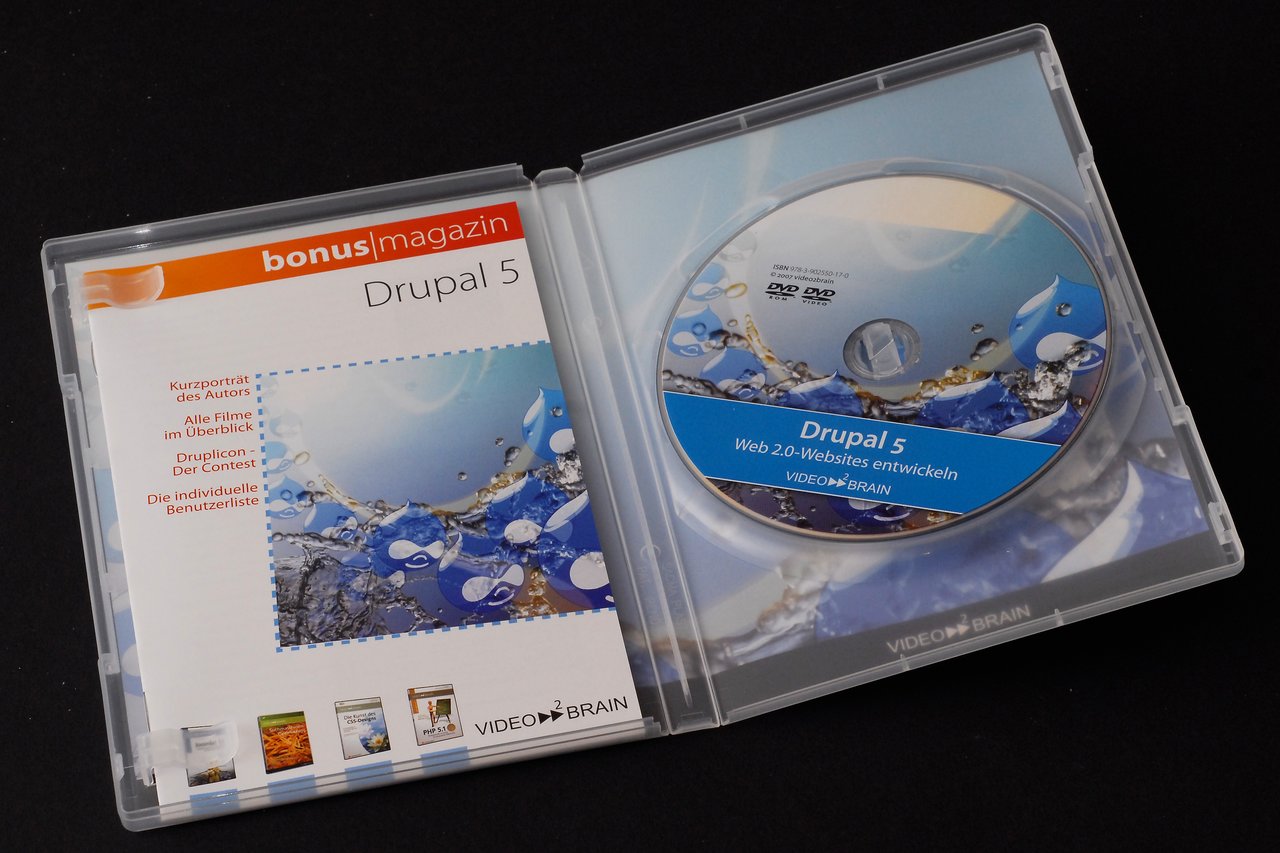
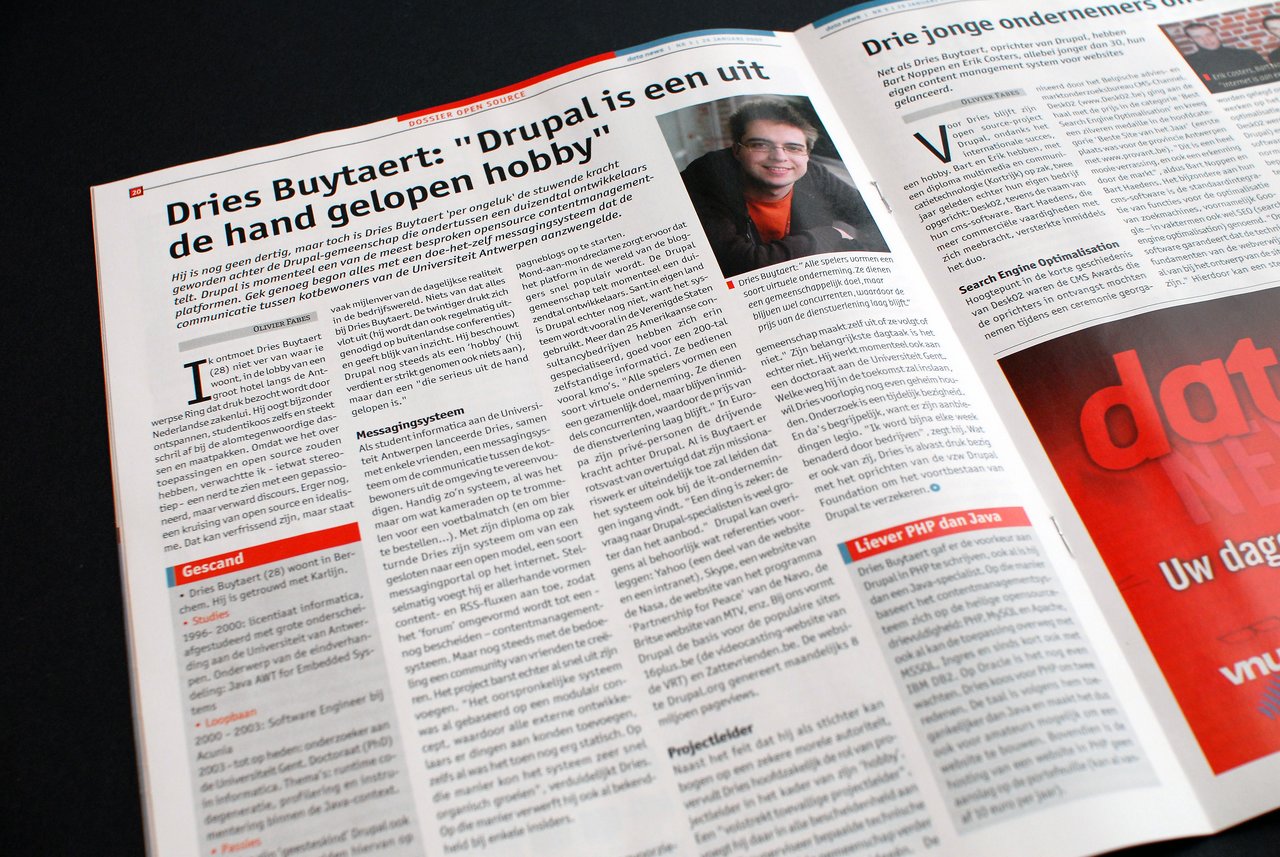
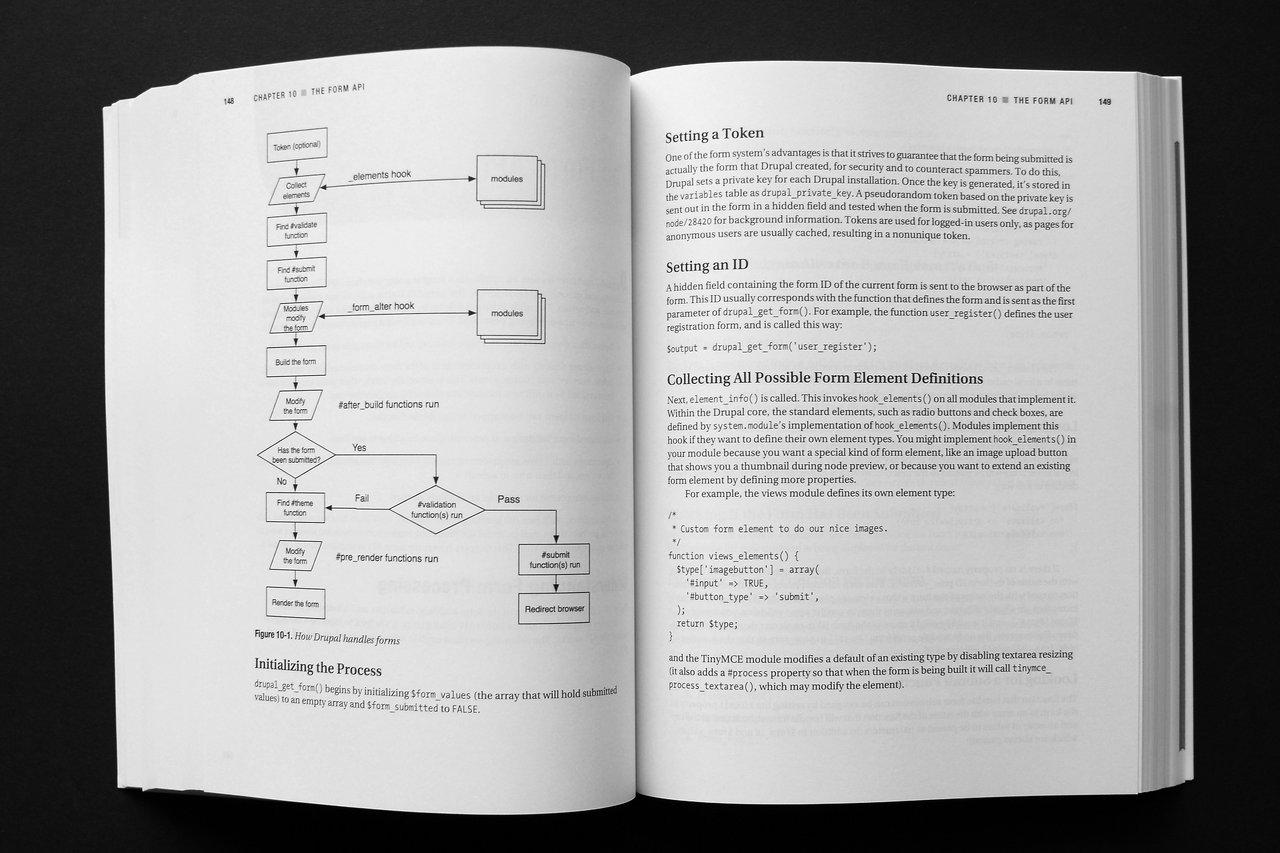
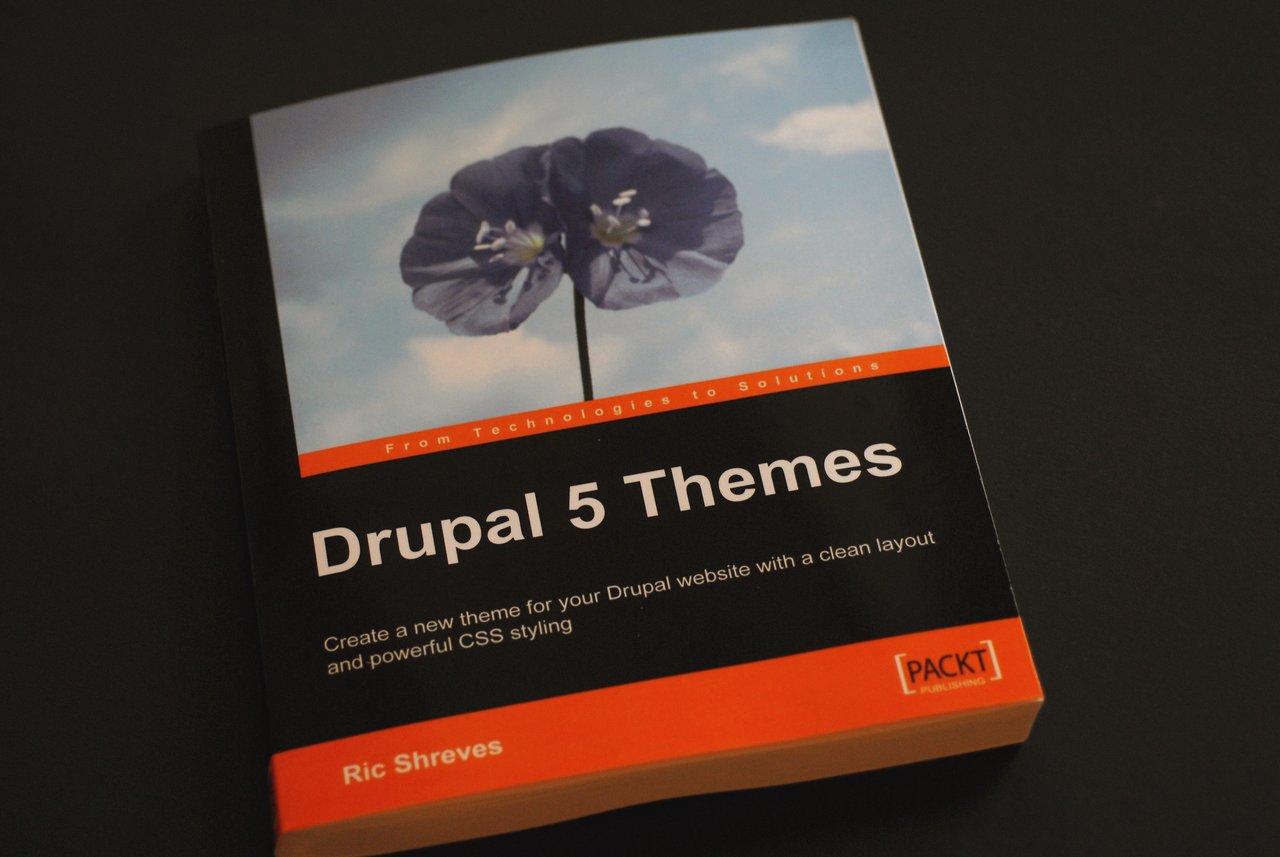
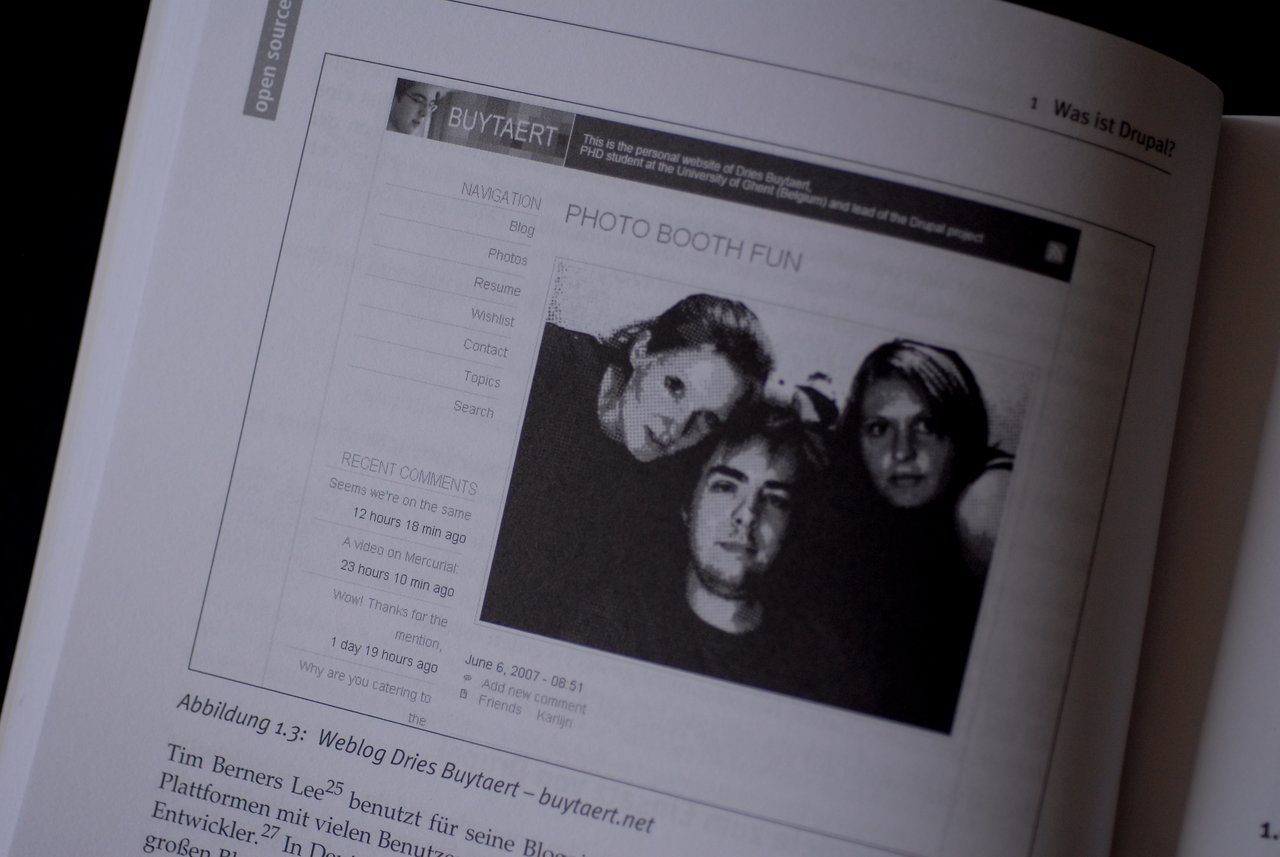 @Hagen, next time take a picture of your book on my website? ;-)
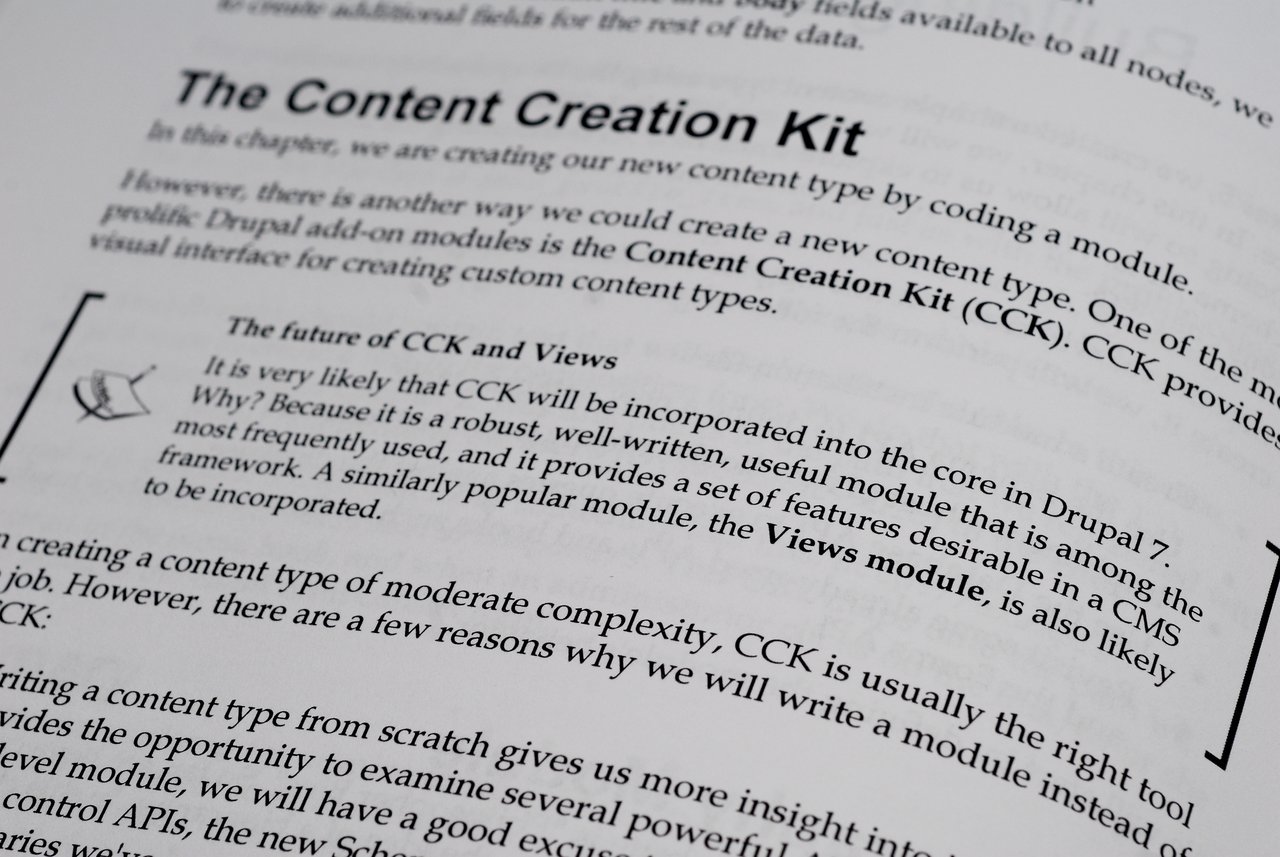
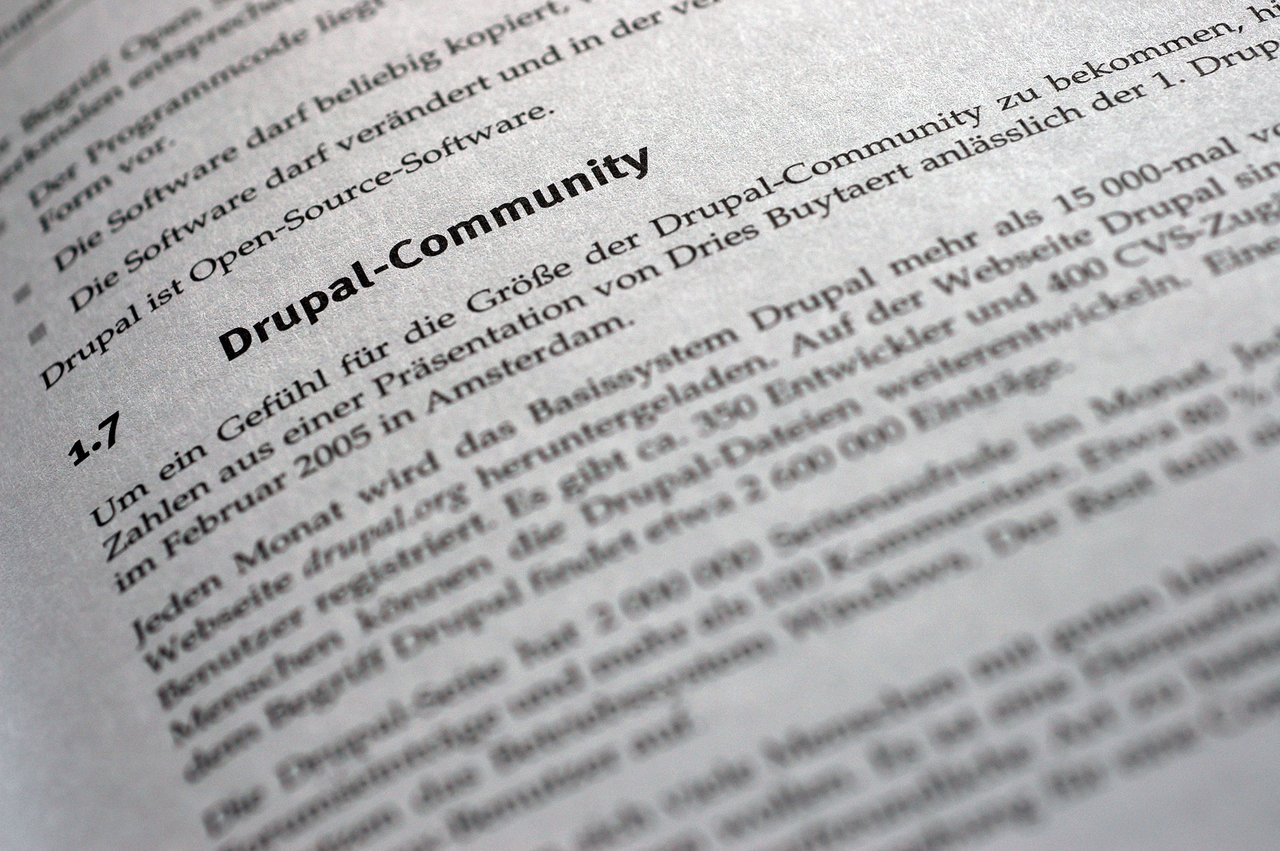
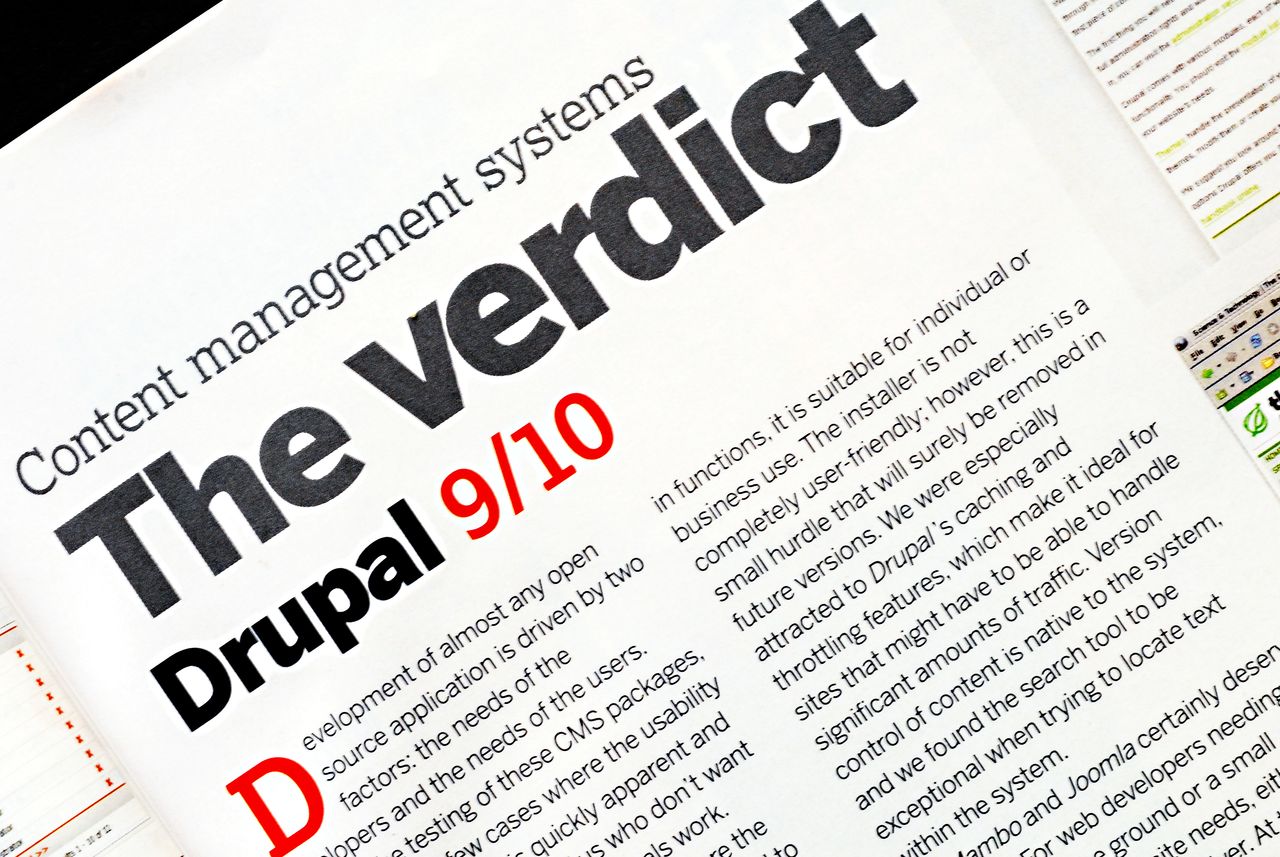
 The book talks about Mollom!







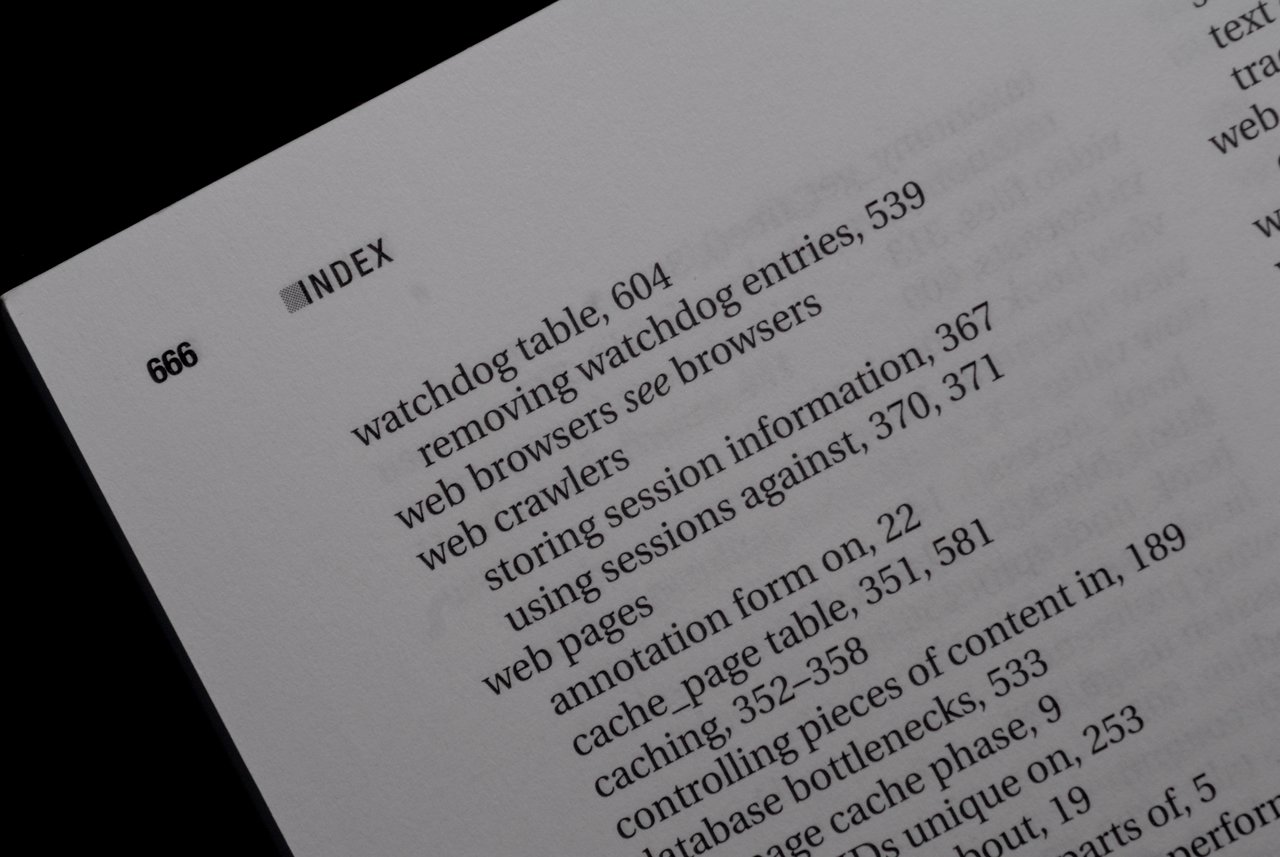

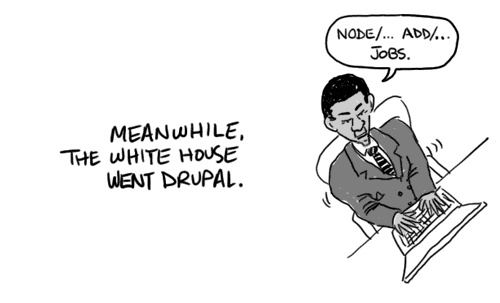
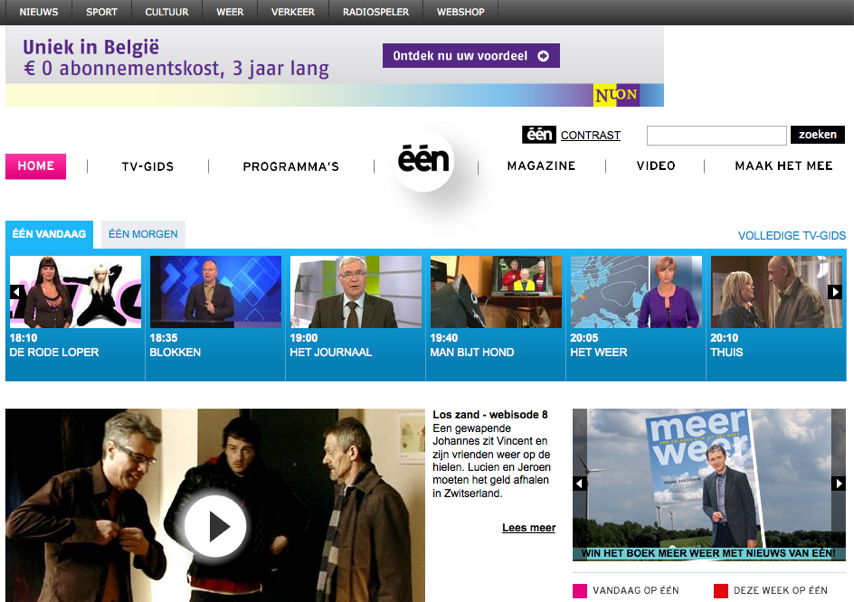
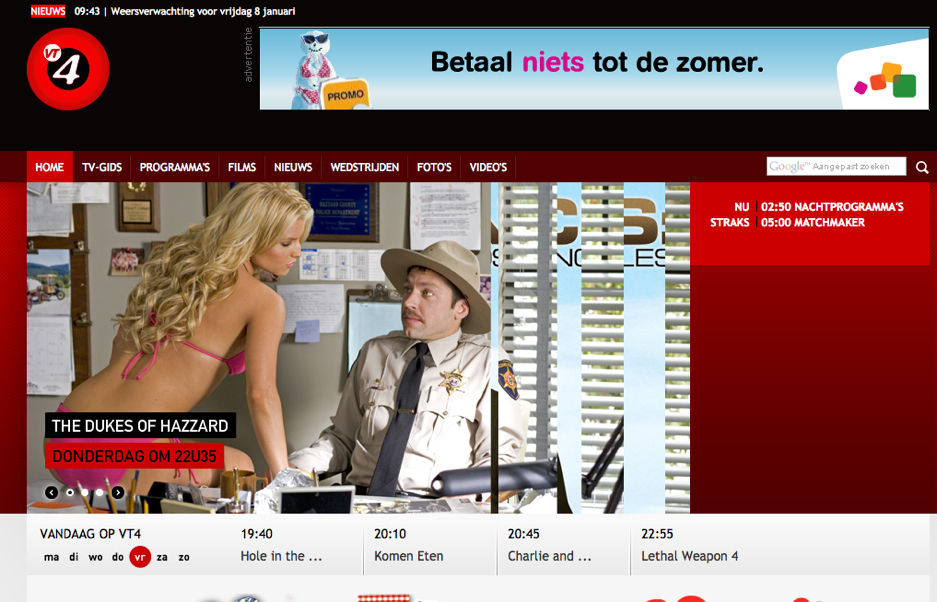
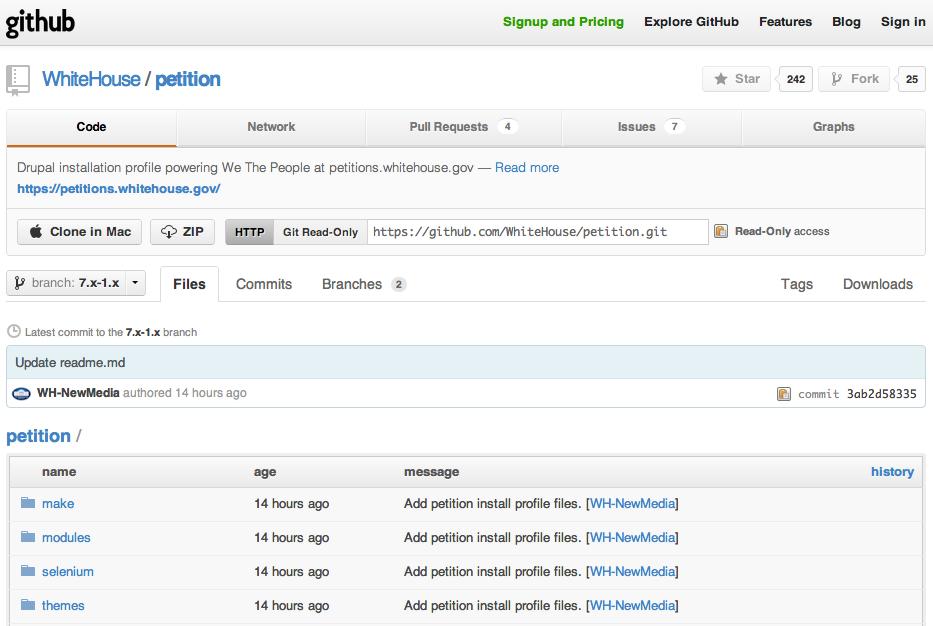
 The question on the TV screen is in Dutch but reads: What was used to build The White House's site?. © Jo Wouters.
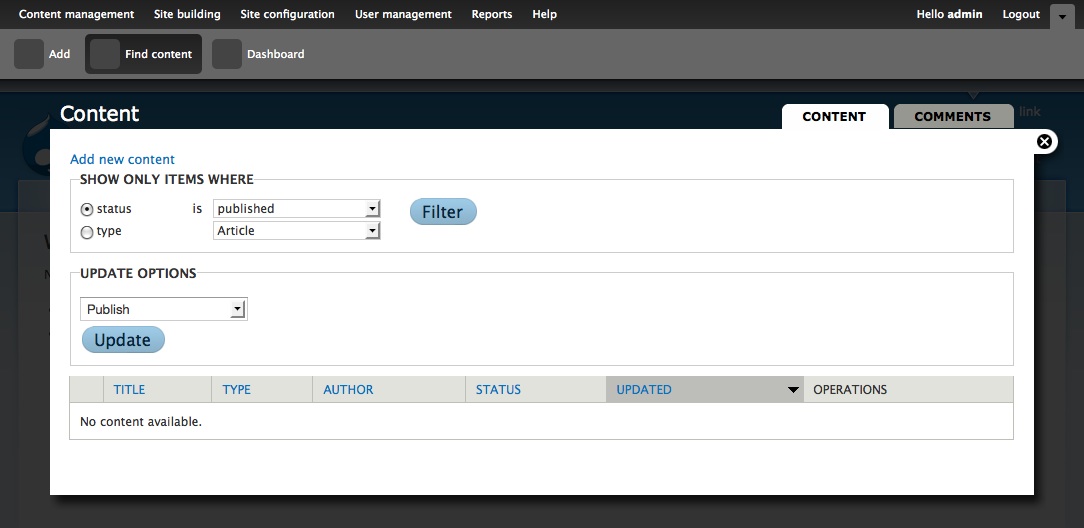
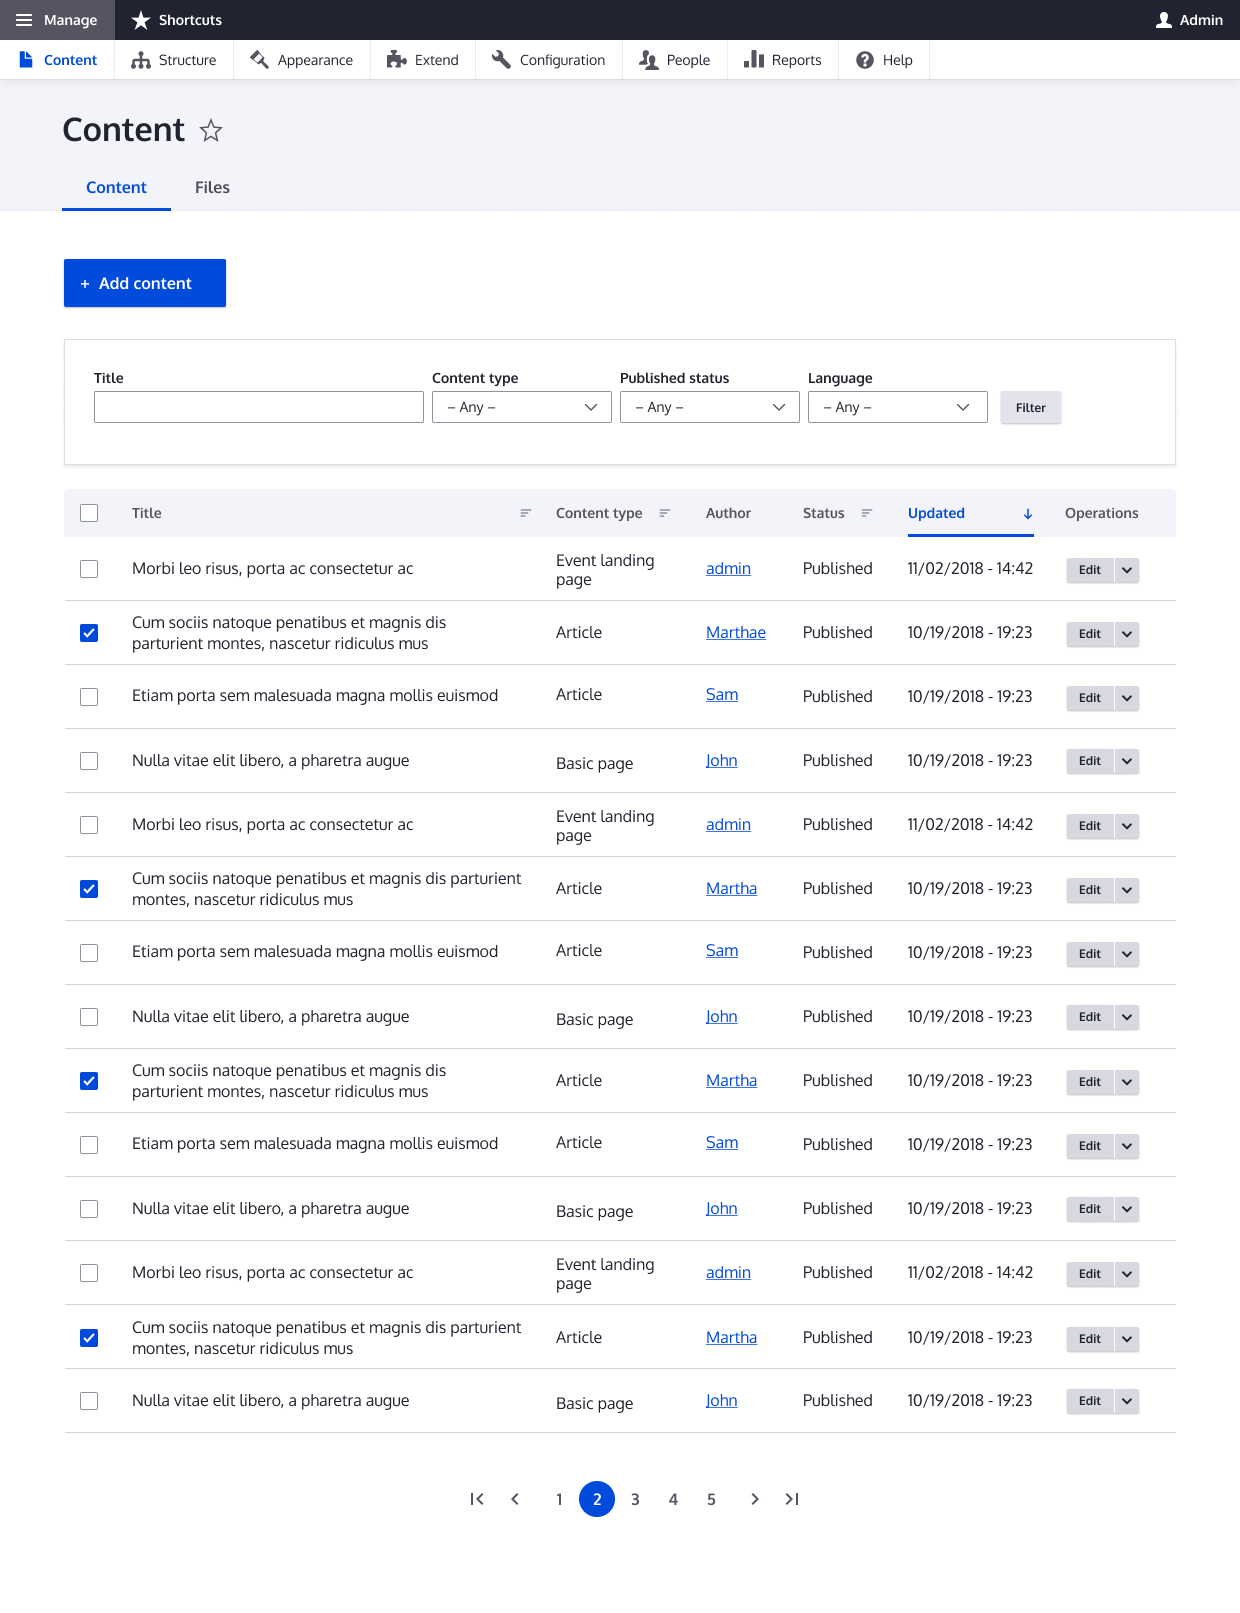 The content administration screen with the new design system.
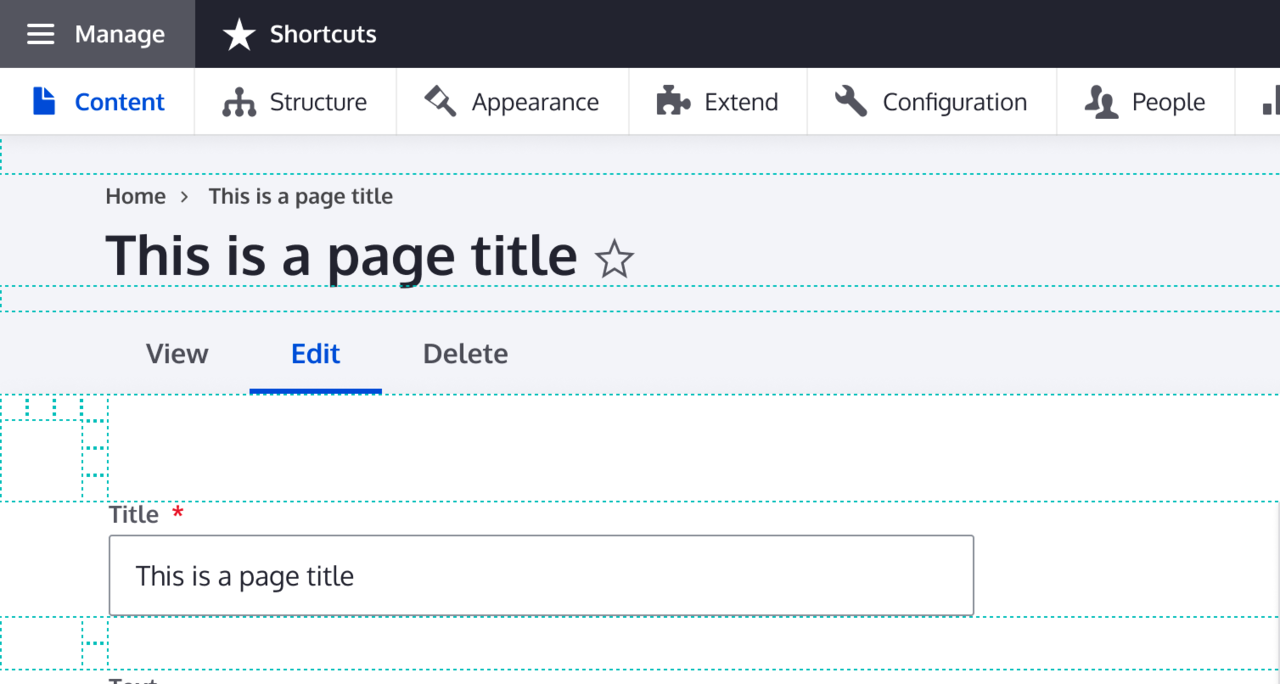 Sample space sizing guidelines from the new design system.

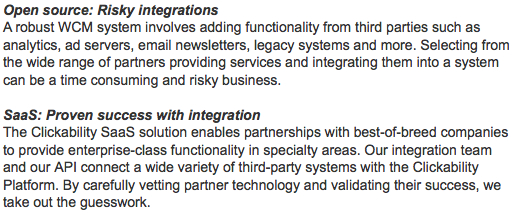 Screenshot taken from Clickability's SaaS vs Open Source comparison. © Clickability.
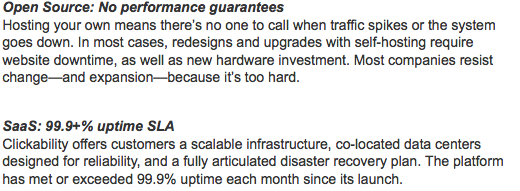 Screenshot taken from Clickability's SaaS vs Open Source comparison. © Clickability.
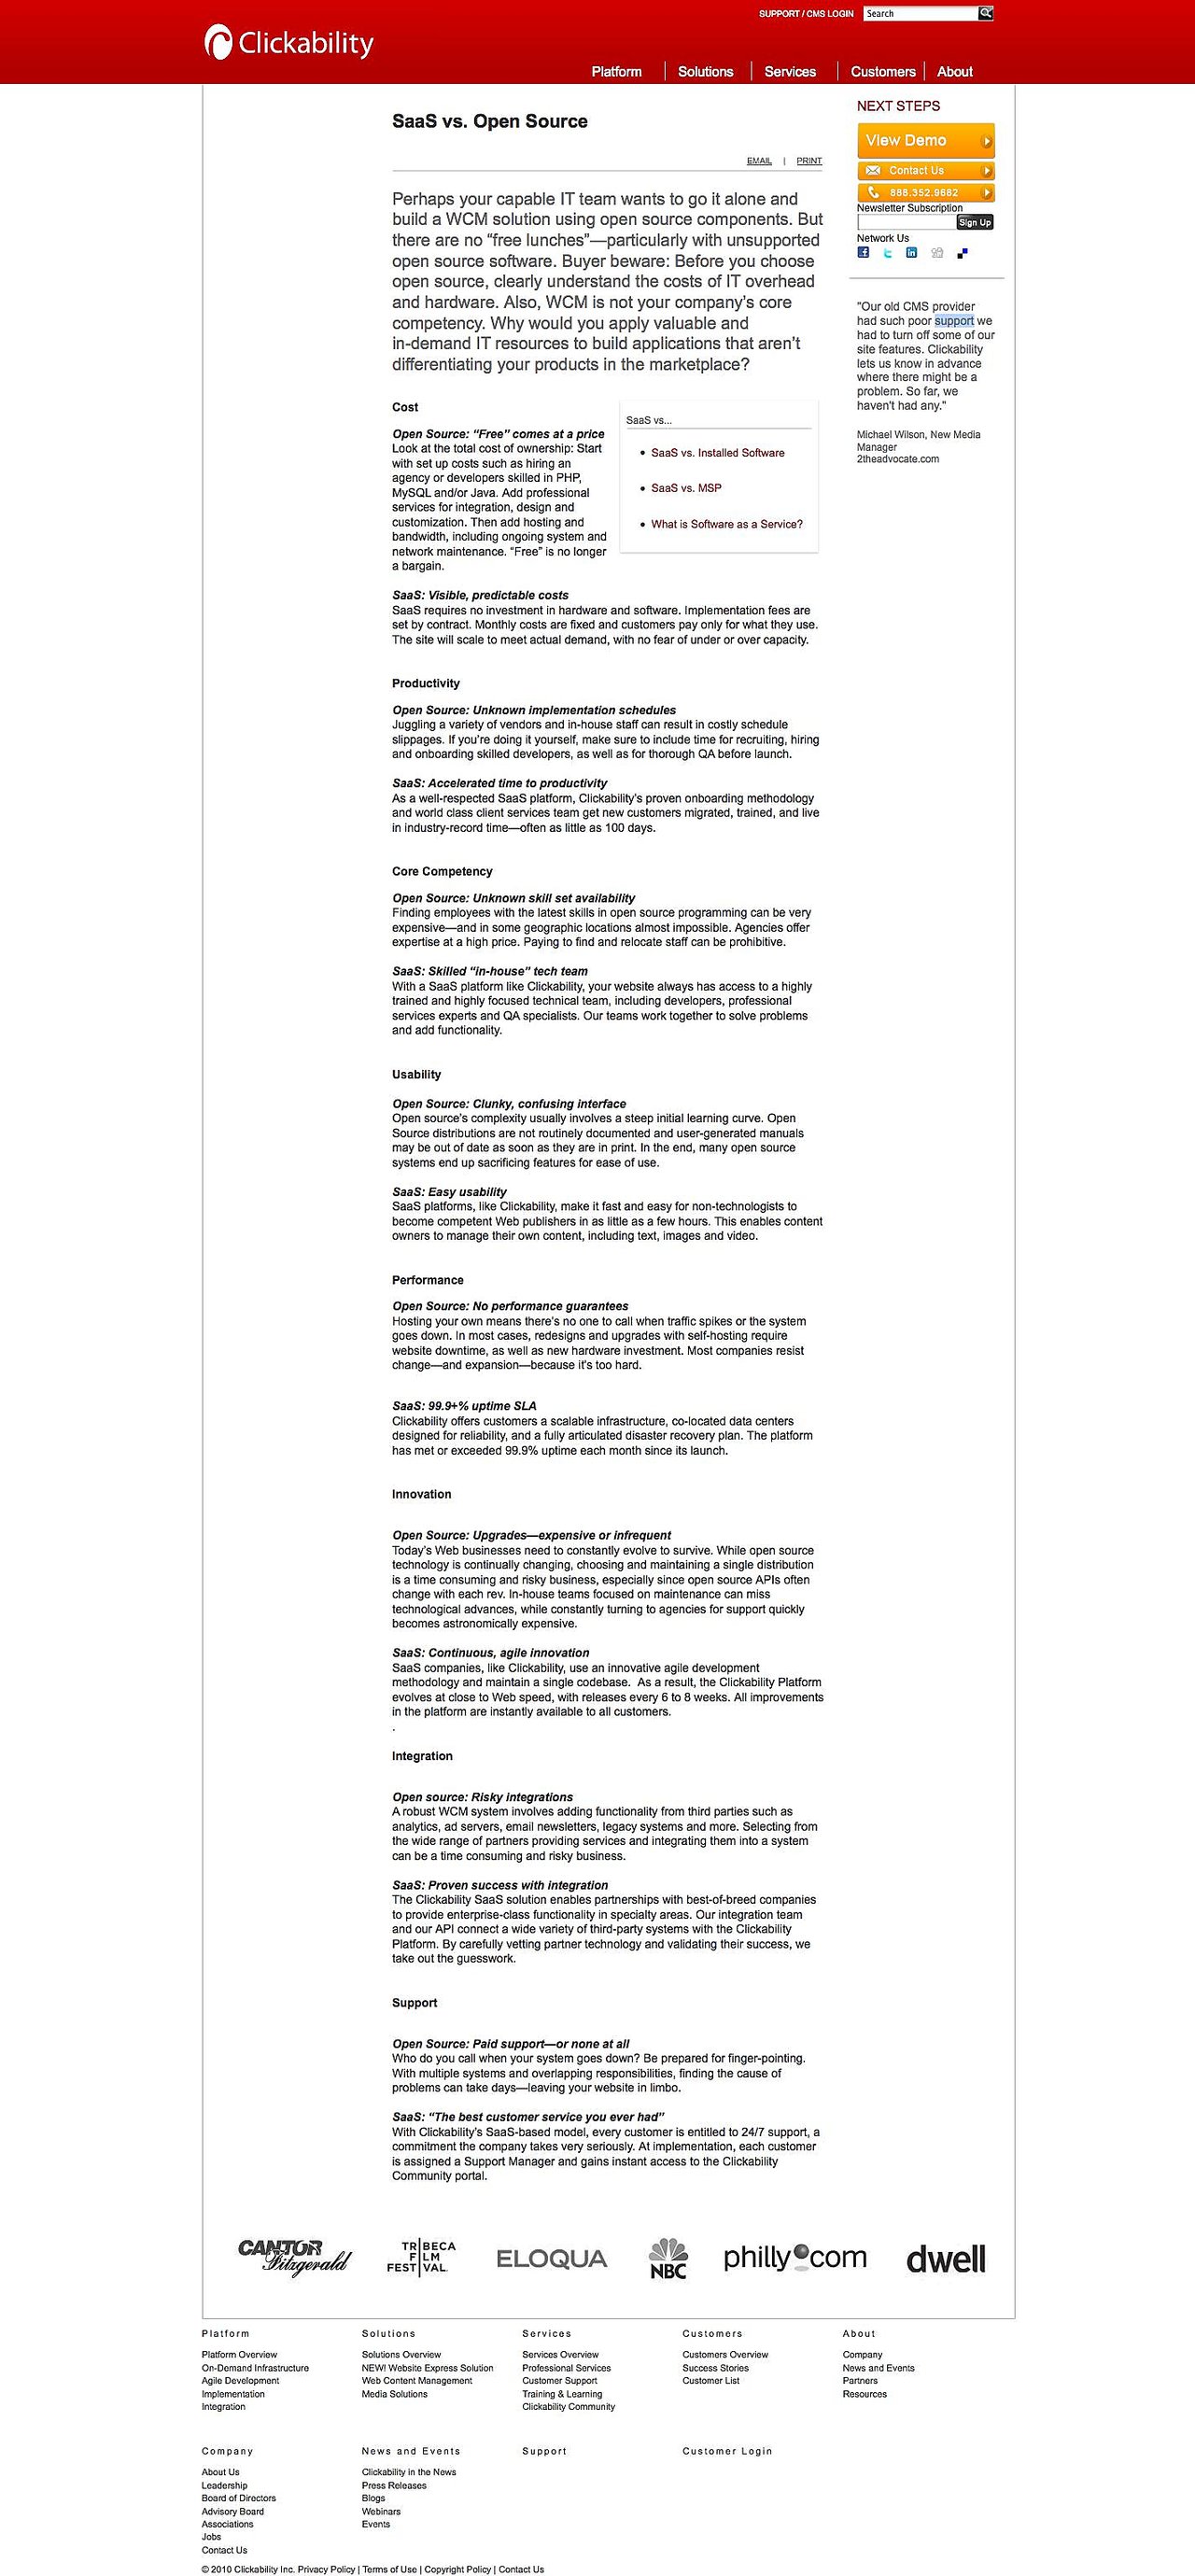
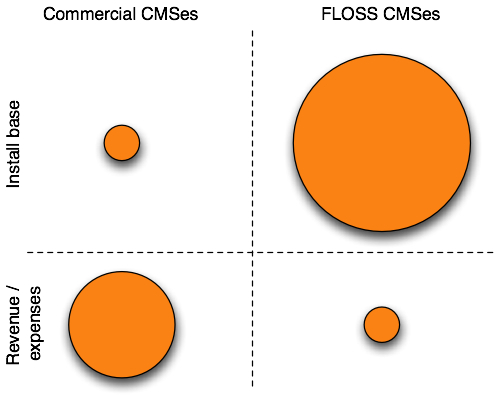 What is wrong with this picture? *Brain teaser.*

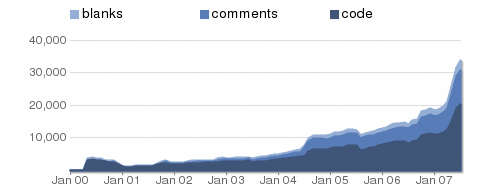 Drupal statistics at Ohloh. © Ohloh.
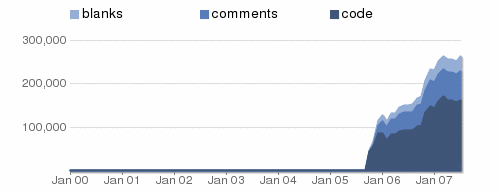 Joomla! statistics at Ohloh. © Ohloh.
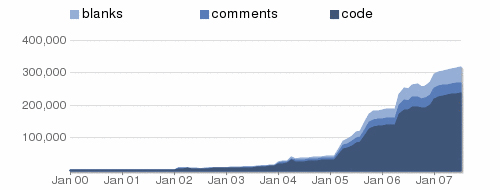 Plone statistics at Ohloh. © Ohloh.
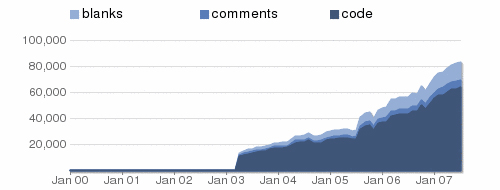 Wordpress statistics at Ohloh. © Ohloh.

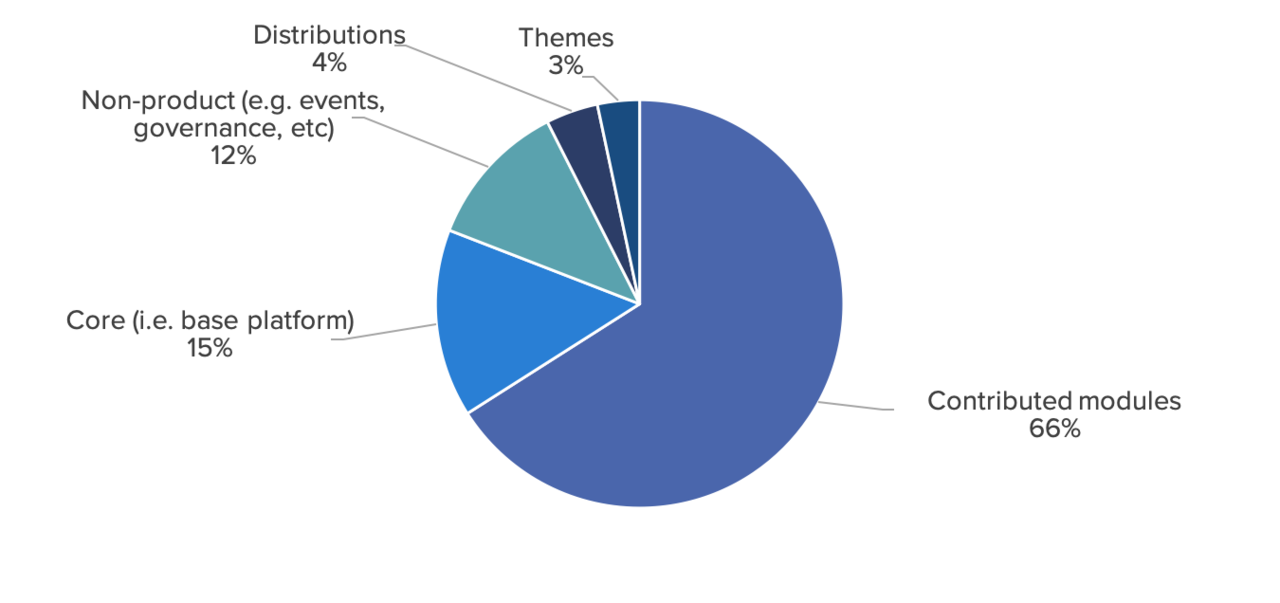
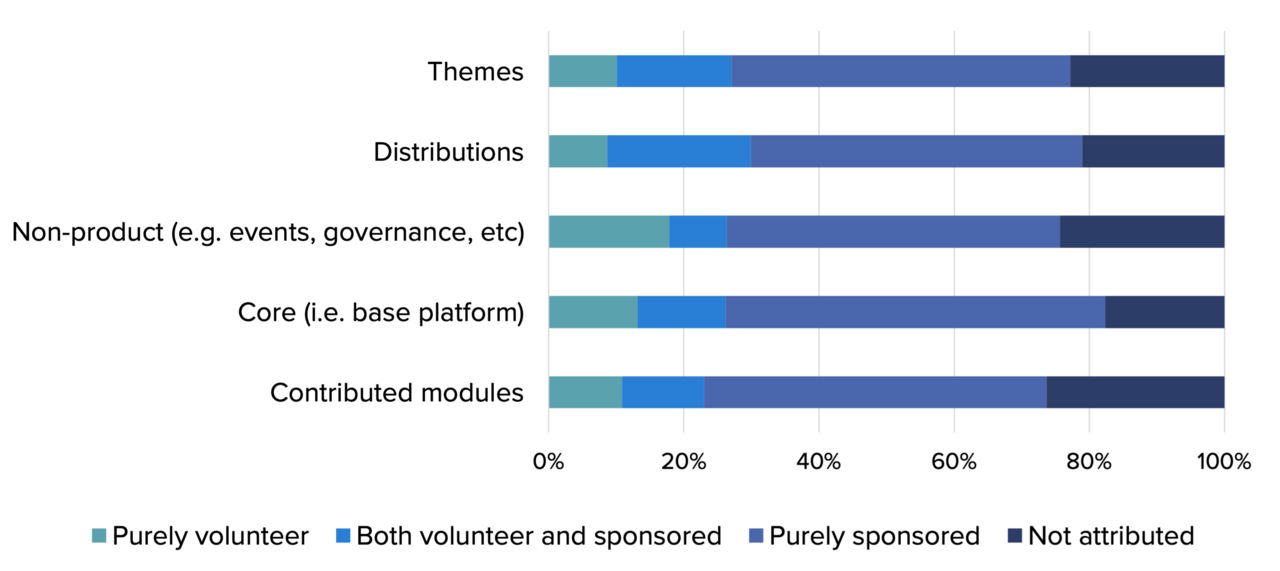
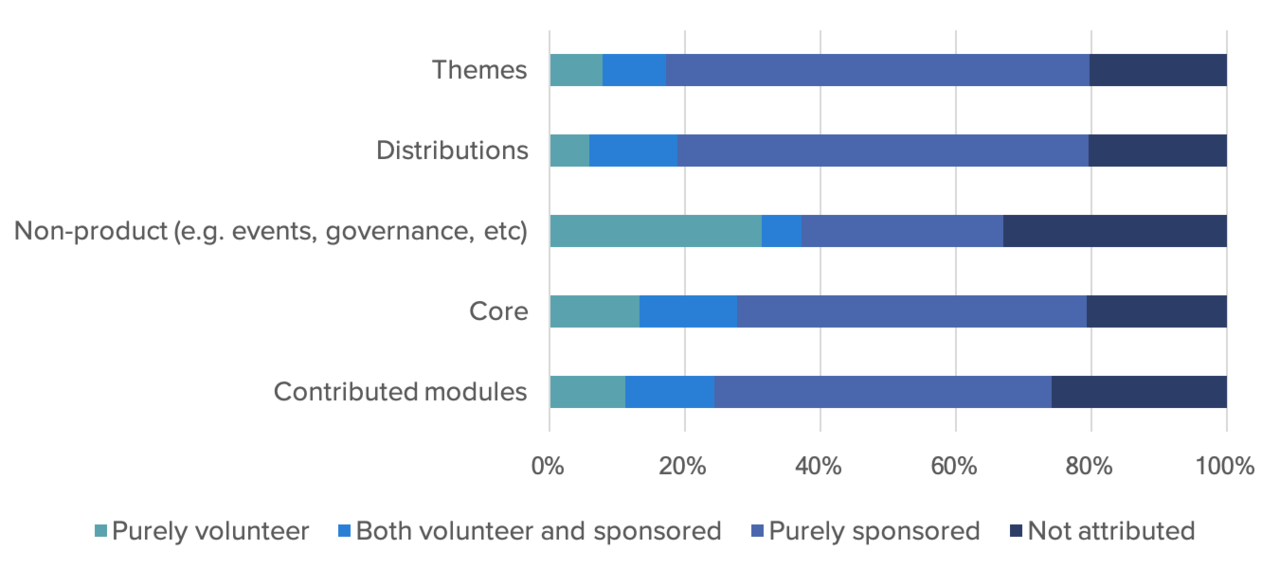
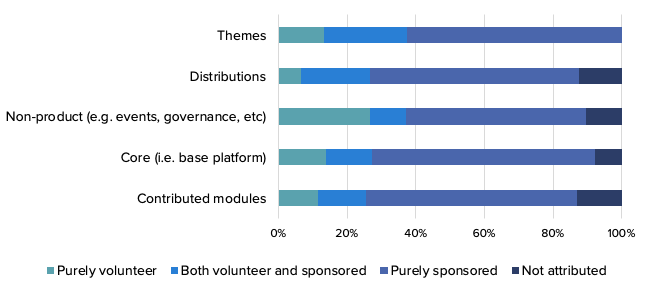
 Aggregated results from core and contributed modules.
 Aggregated results from core and contributed modules.
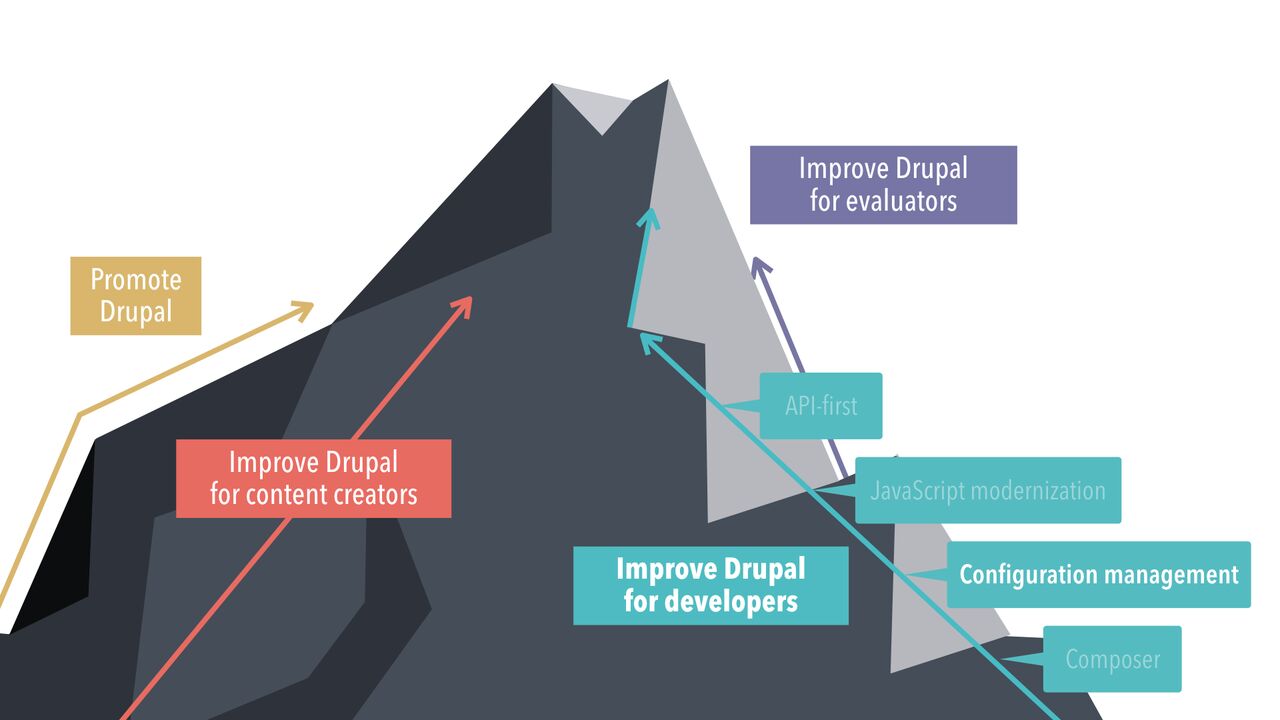 The four different focus areas for Drupal 8. The configuration management initiative is part of the 'Improve Drupal for developers' track.
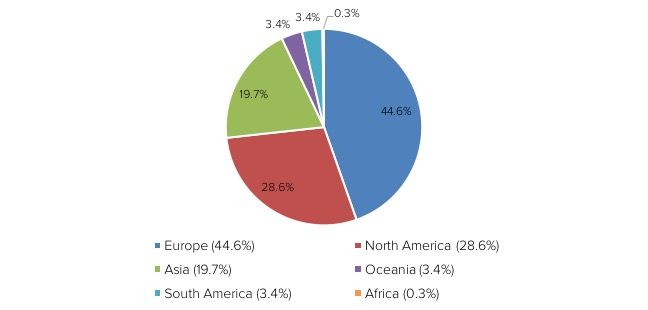
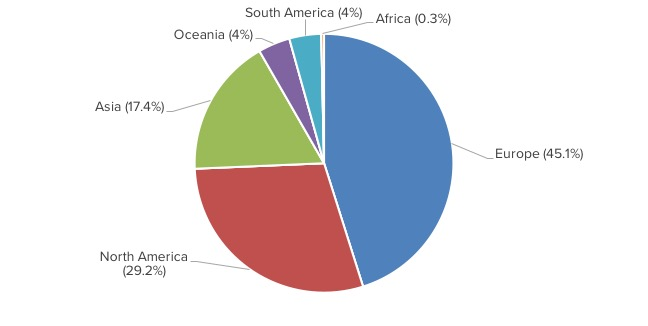
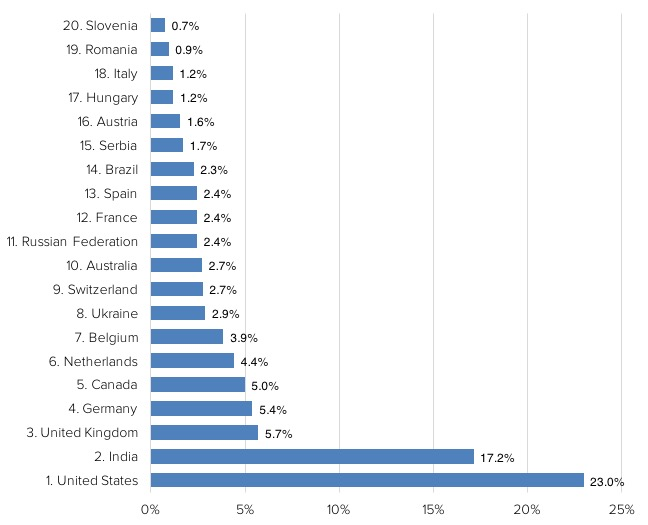 The top 20 countries from which contributions originate. The data is compiled by aggregating the countries of all individual contributors behind each commit. Note that the geographical location of contributors doesn't always correspond with the origin of their sponsorship. Wim Leers, for example, works from Belgium, but his funding comes from Acquia, which has the majority of its customers in North America.
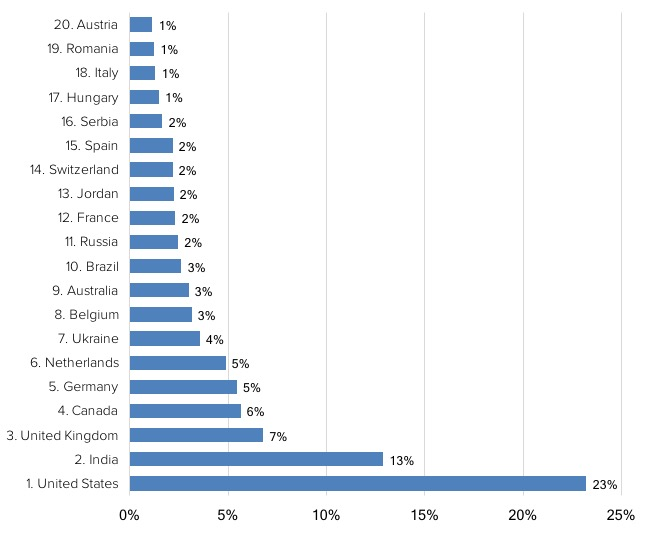 The top 20 countries from which contributions originate. The data is compiled by aggregating the countries of all individual contributors behind each commit. Note that the geographical location of contributors doesn't always correspond with the origin of their sponsorship. Wim Leers, for example, works from Belgium, but his funding comes from Acquia, which has the majority of its customers in North America.
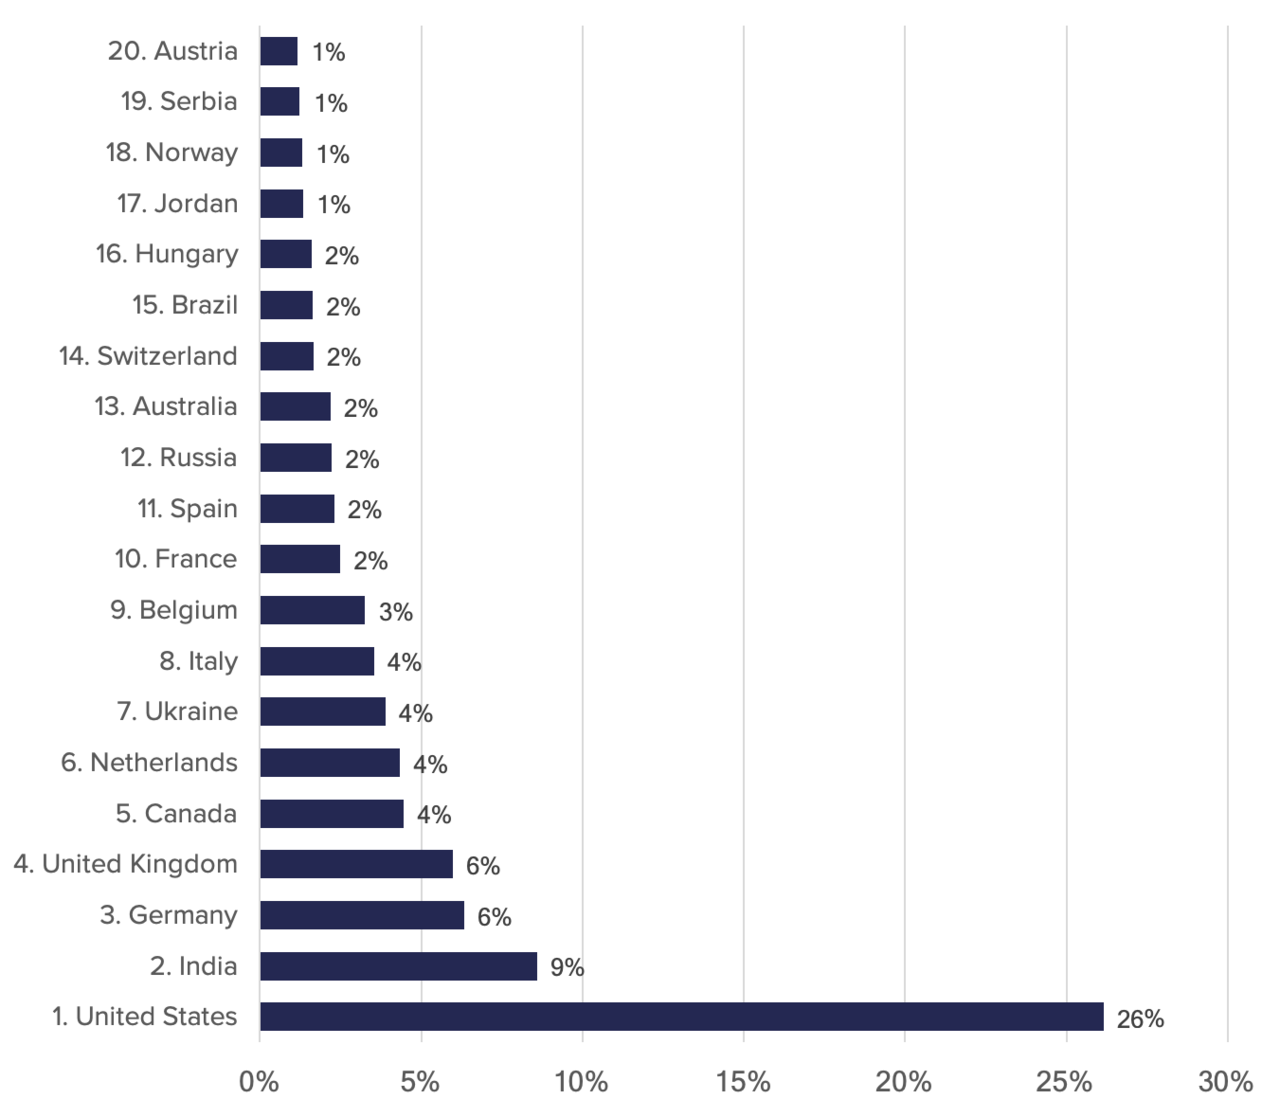 The top 20 countries from which contributions originate. The data is compiled by aggregating the countries of all individual contributors behind each issue. Note that the geographical location of contributors doesn't always correspond with the origin of their sponsorship. Wim Leers, for example, works from Belgium, but his funding comes from Acquia, which has the majority of its customers in North America.
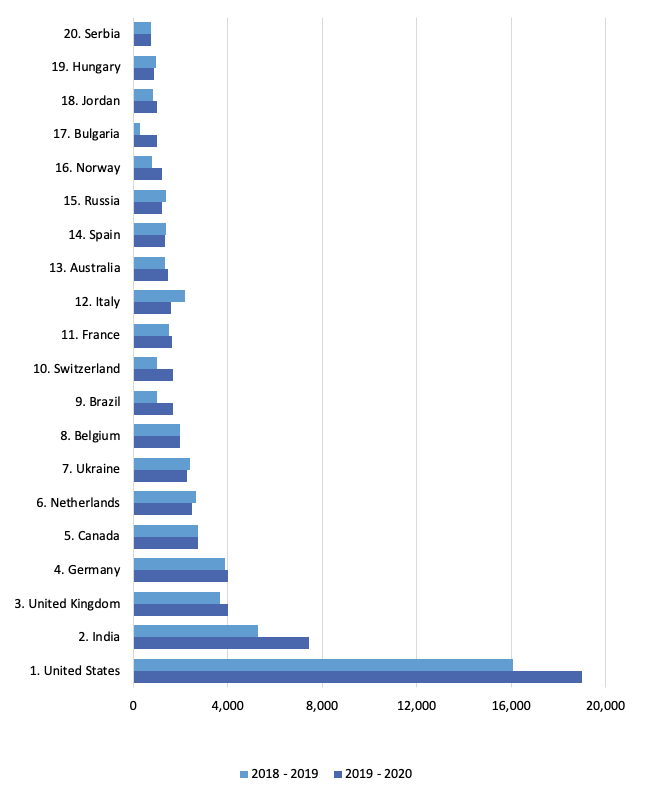 The top 20 countries from which contributions originate. The data is compiled by aggregating the countries of all individual contributors behind each issue. Note that the geographical location of contributors doesn't always correspond with the origin of their sponsorship. Wim Leers, for example, works from Belgium, but his funding comes from Acquia, which has the majority of its customers in North America. Wim's contributions count towards Belgium as that is his country of residence.
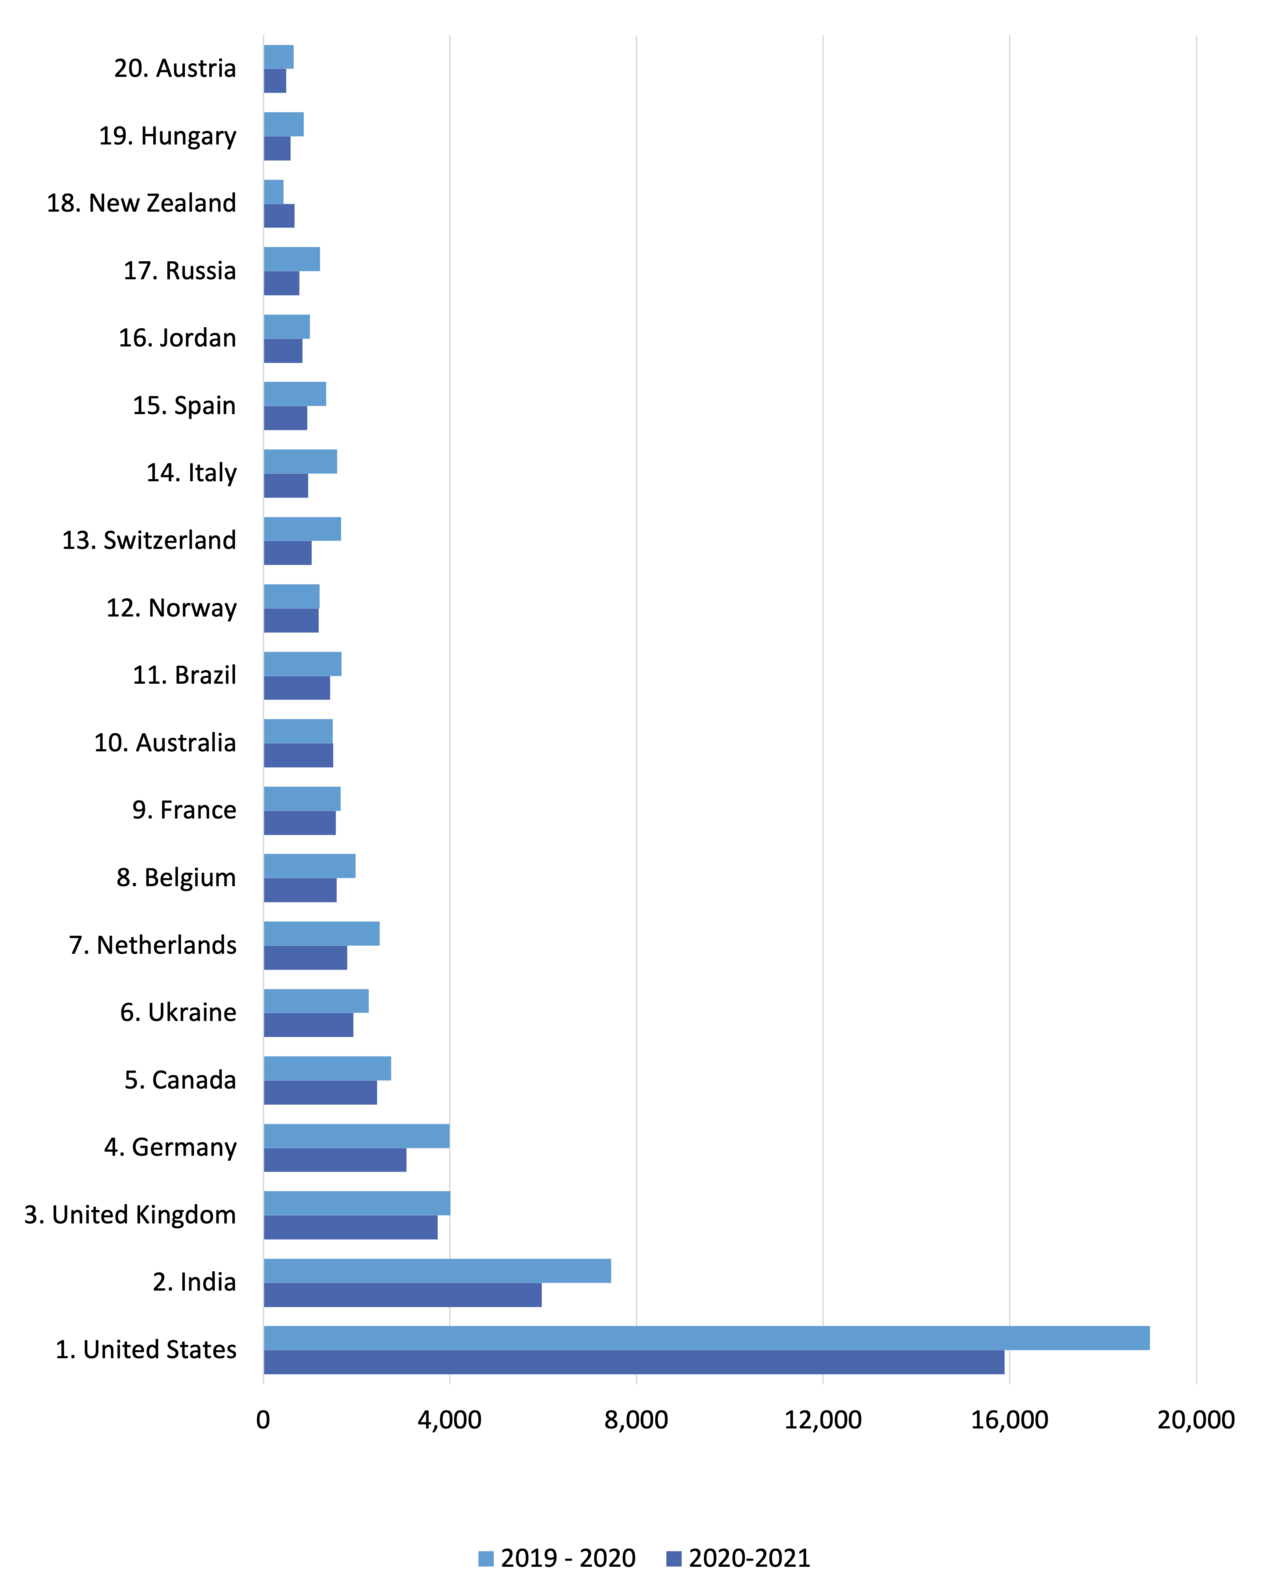 The top 20 countries from which contributions originate. The data is compiled by aggregating the countries of all individual contributors behind each issue. Note that the geographical location of contributors doesn't always correspond with the origin of their sponsorship. Wim Leers, for example, works from Belgium, but his funding comes from Acquia, which has the majority of its customers in North America. Wim's contributions count towards Belgium as that is his country of residence.
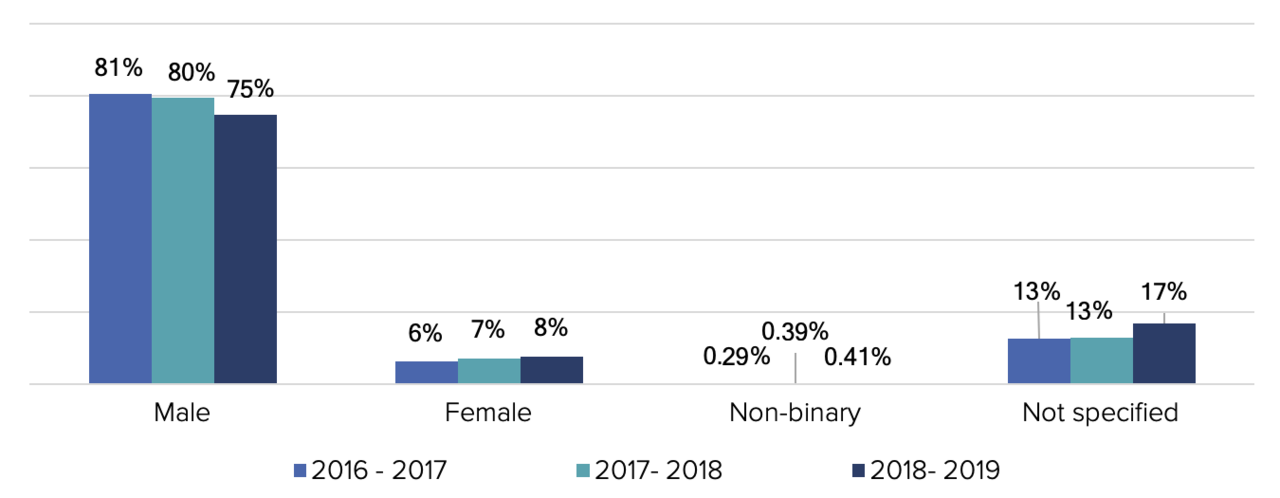
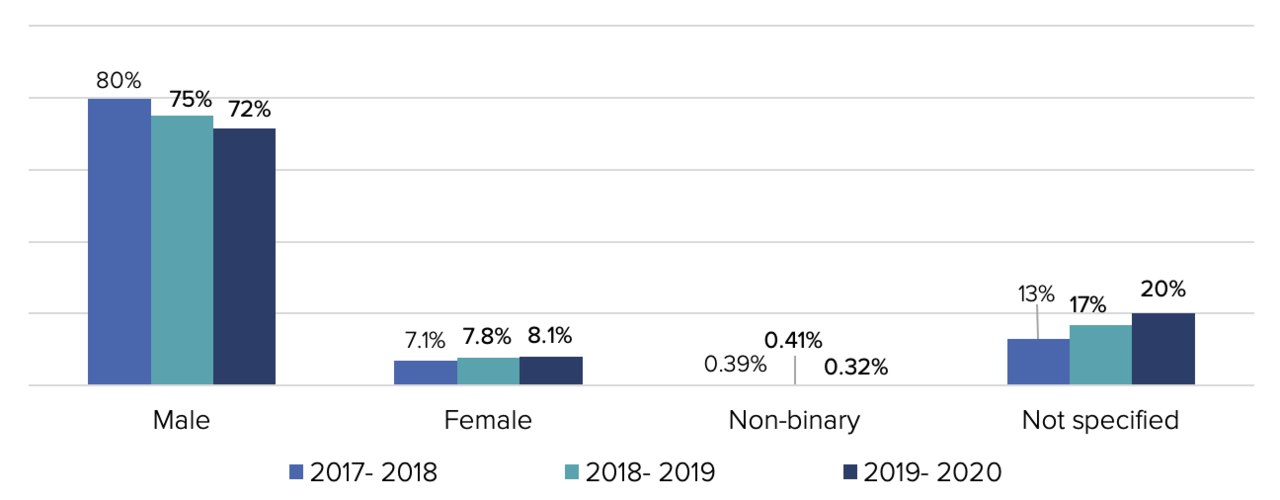
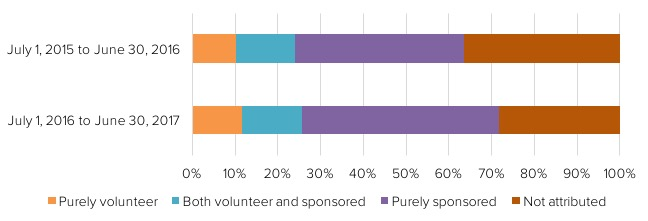
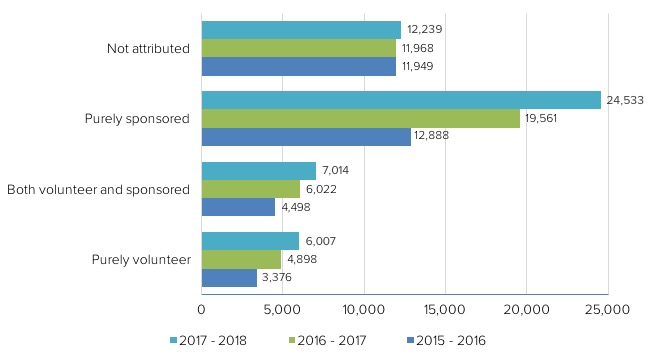
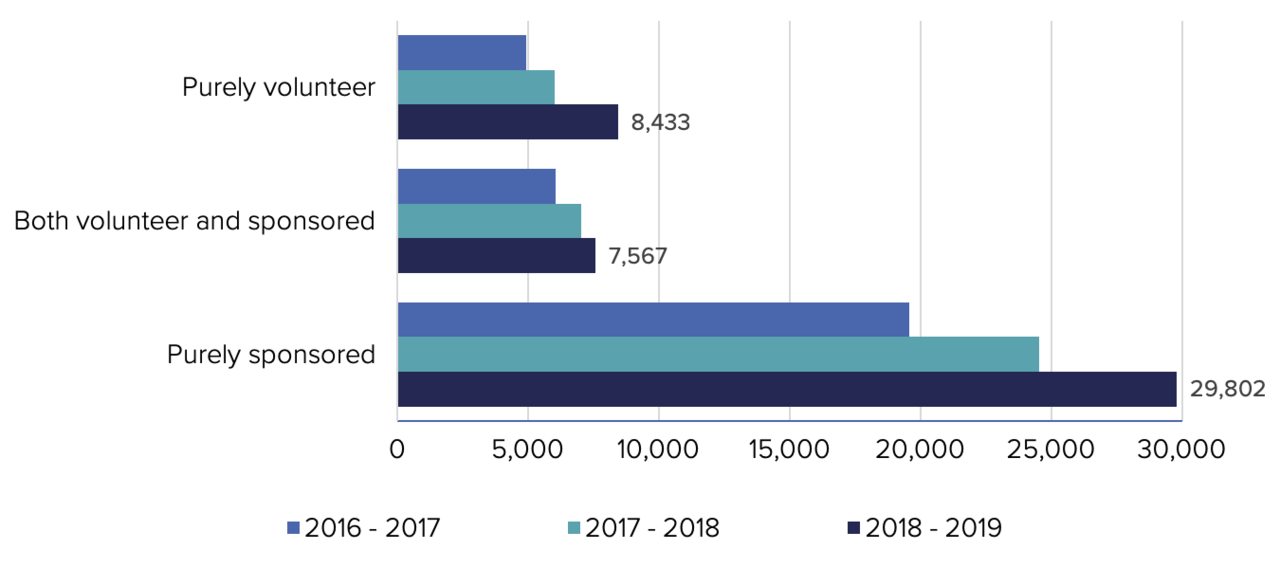
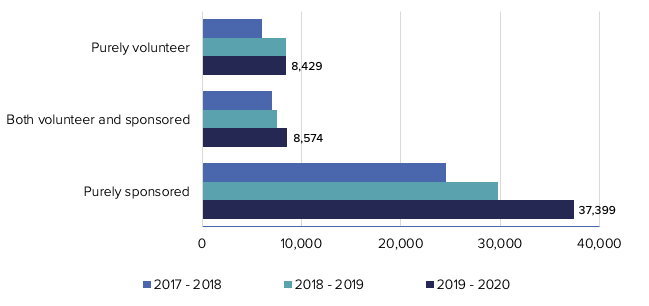
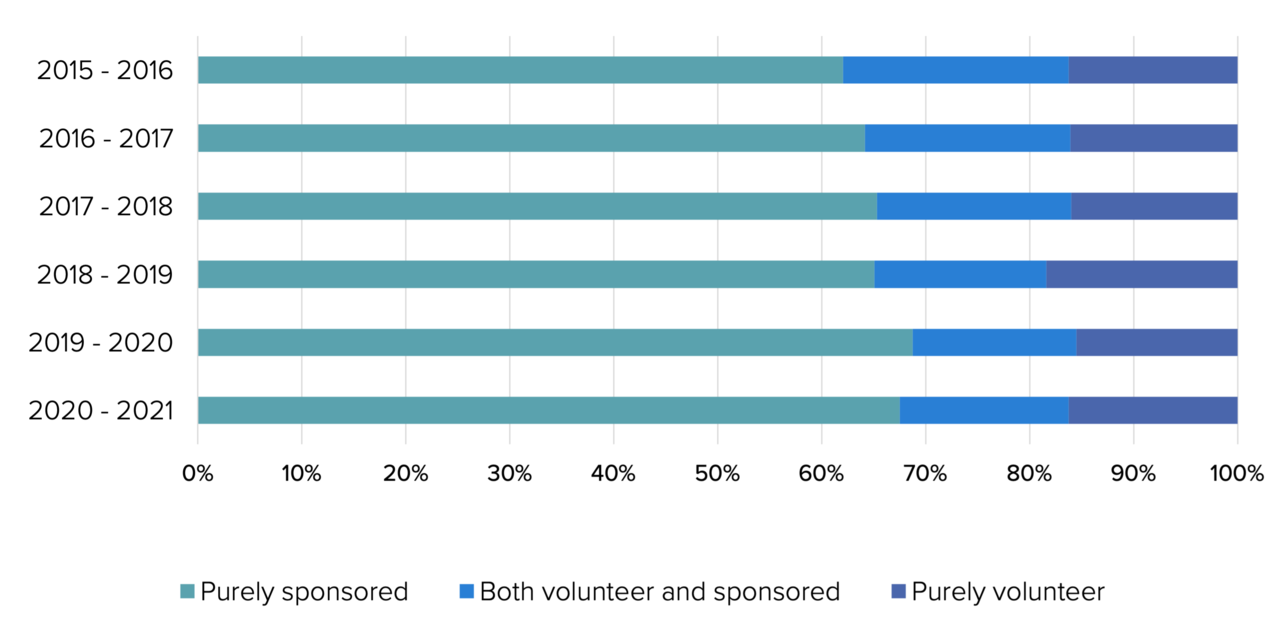
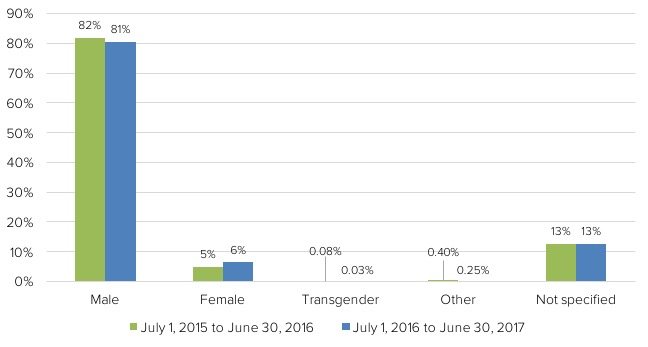
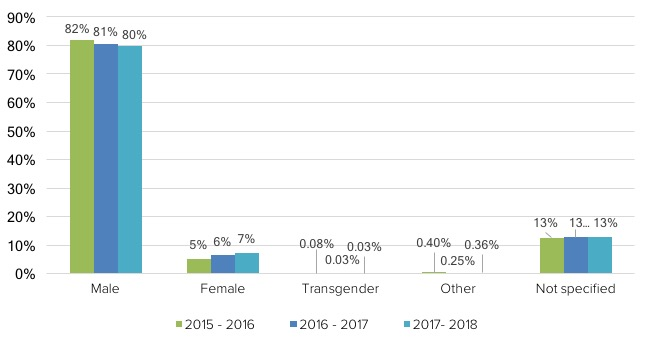
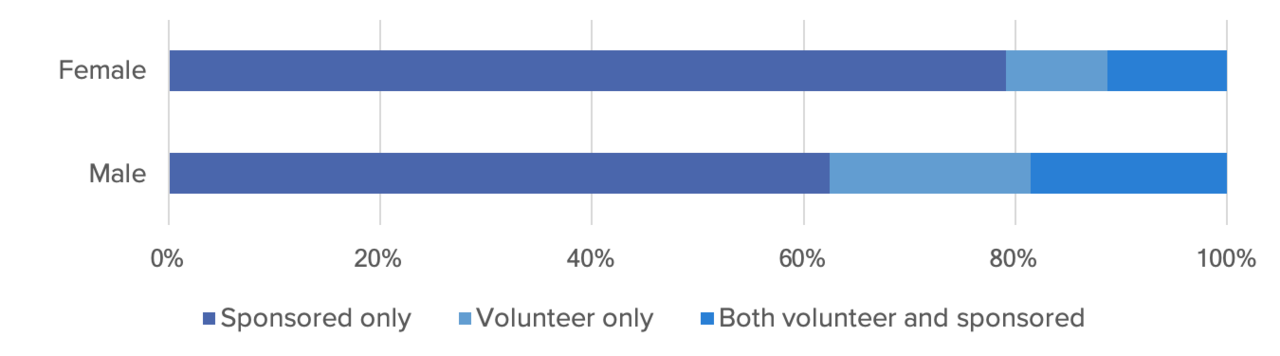 Compared to men, women do more sponsored work, and less volunteer work. We believe this is because men have the privilege of more free time.
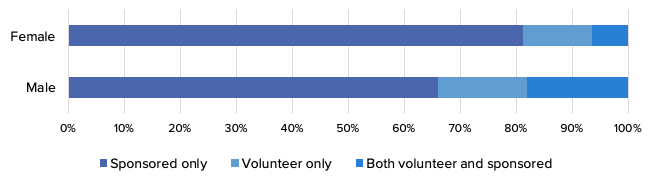 Compared to men, women do more sponsored work, and less volunteer work. We believe this is because men have the privilege of more free time.
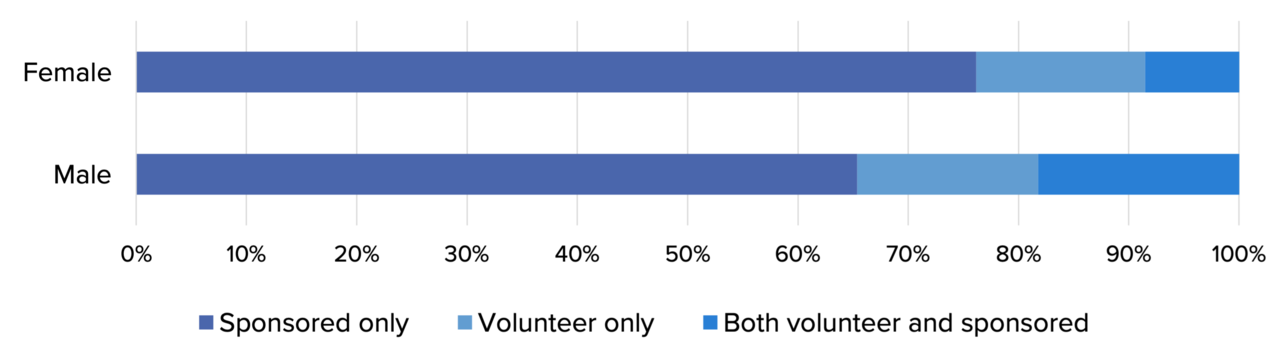 Compared to men, women do more sponsored work, and less volunteer work. We believe this is because men have the privilege of more free time.
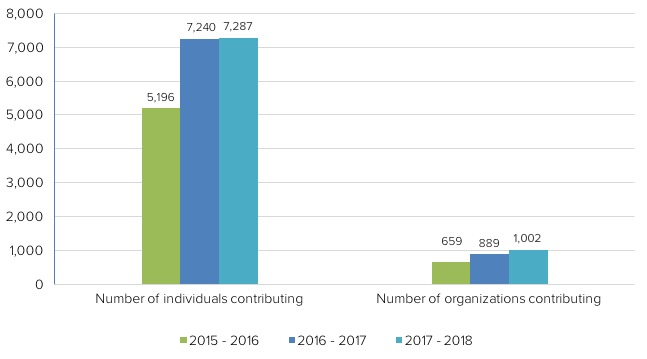
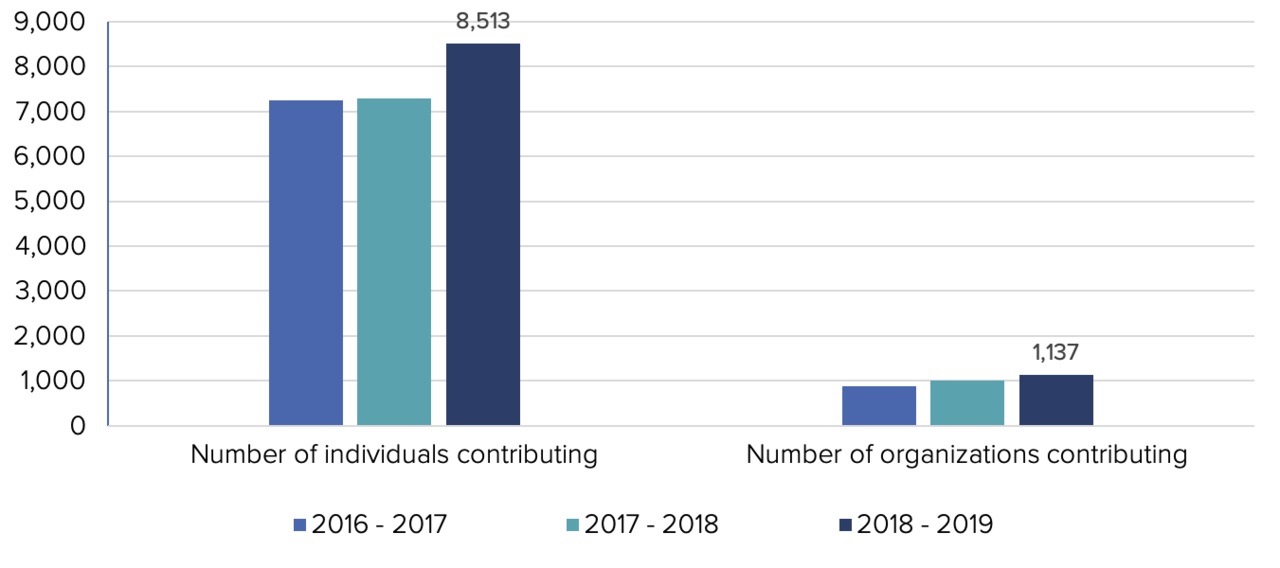
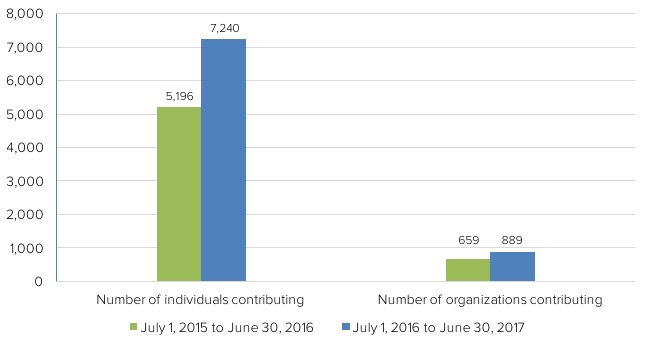 The number of individual contributors is up 28% year over year and the number of organizations contributing is up 26% year over year.
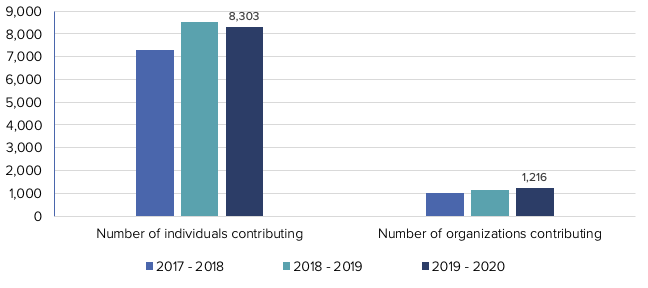
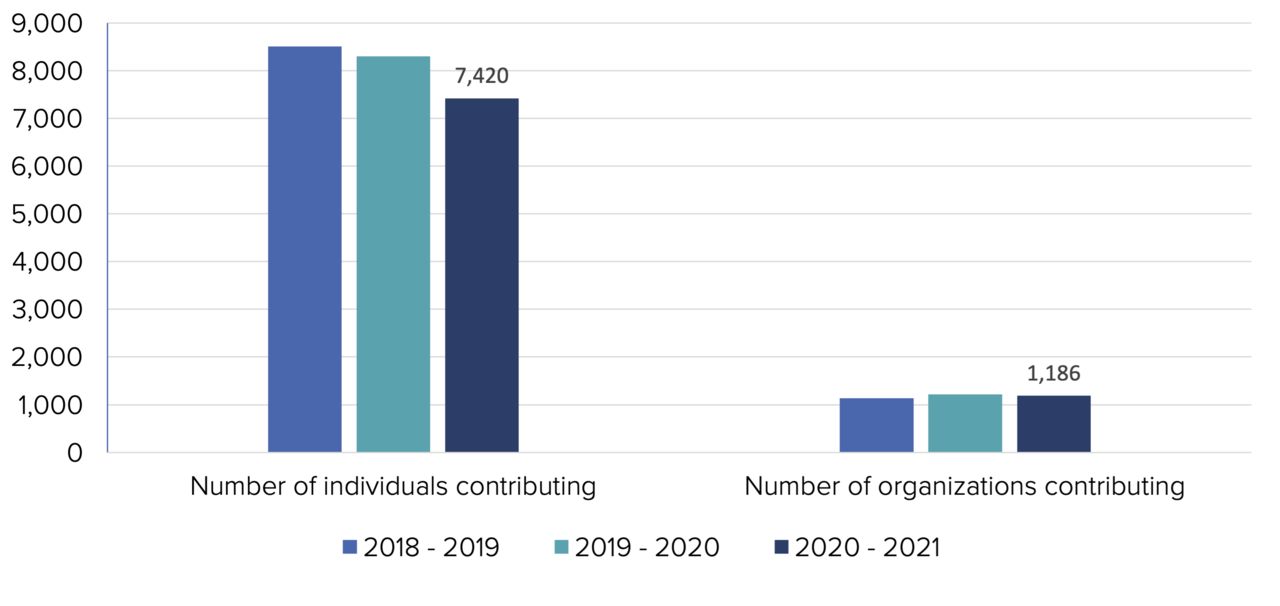
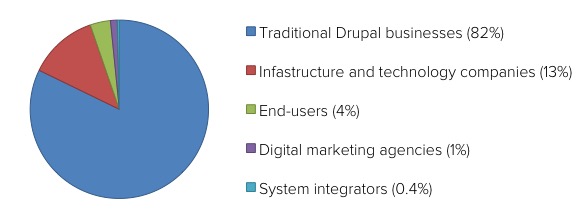
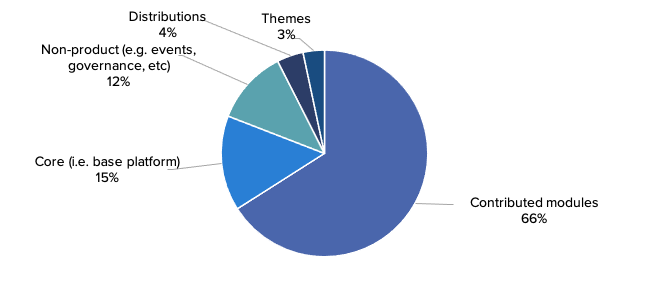
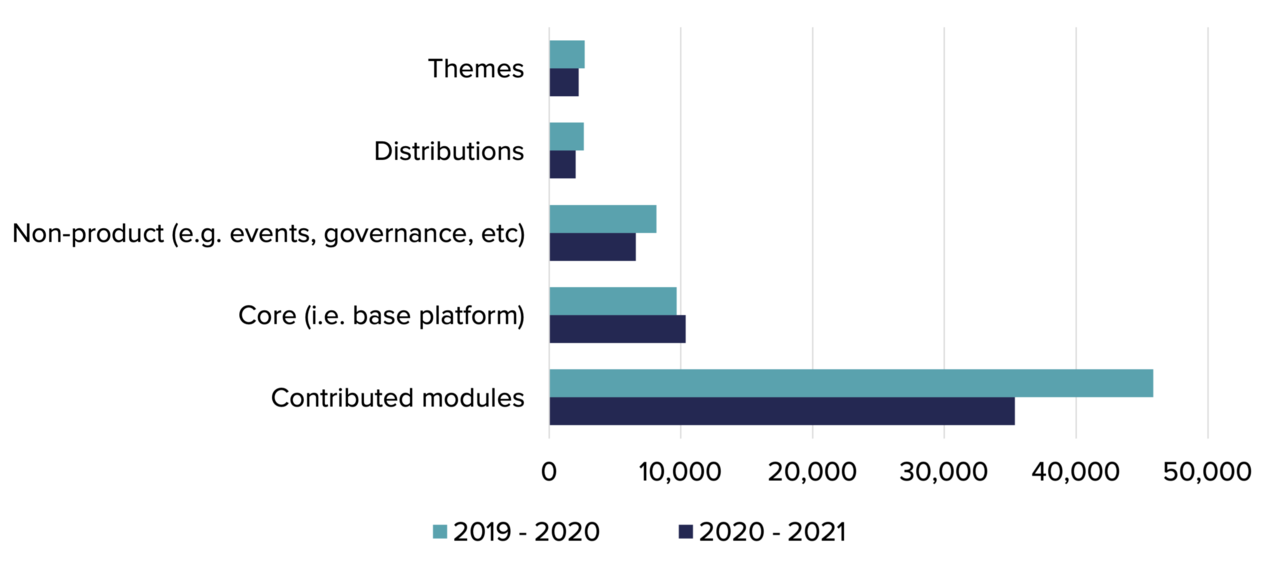
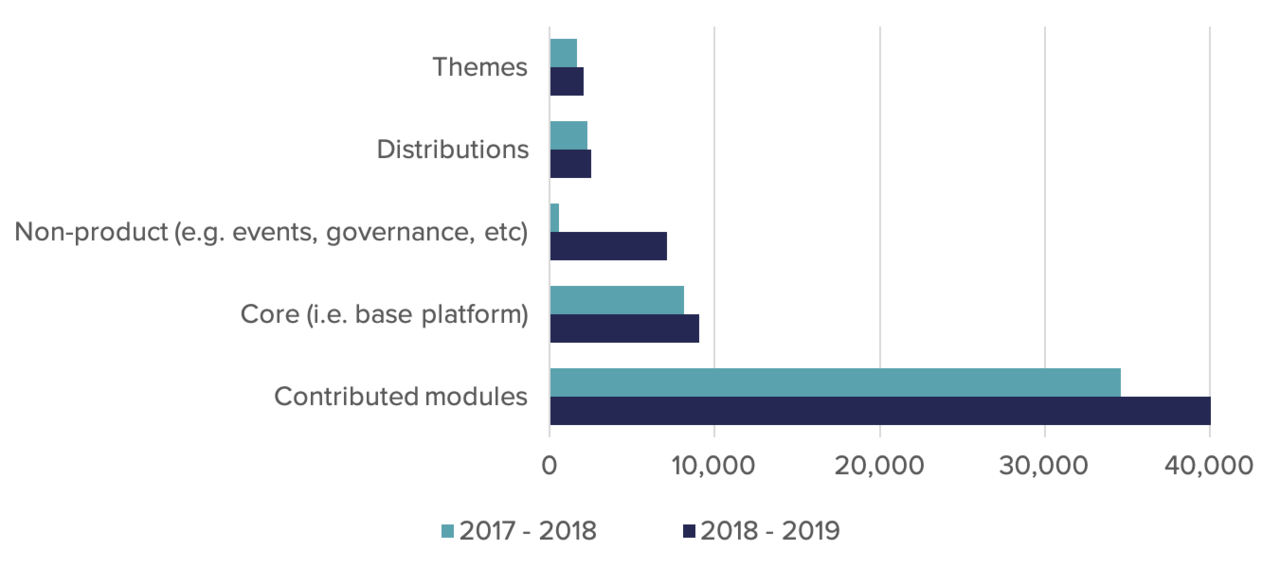
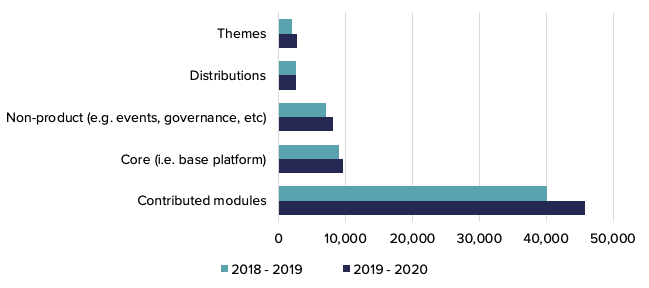
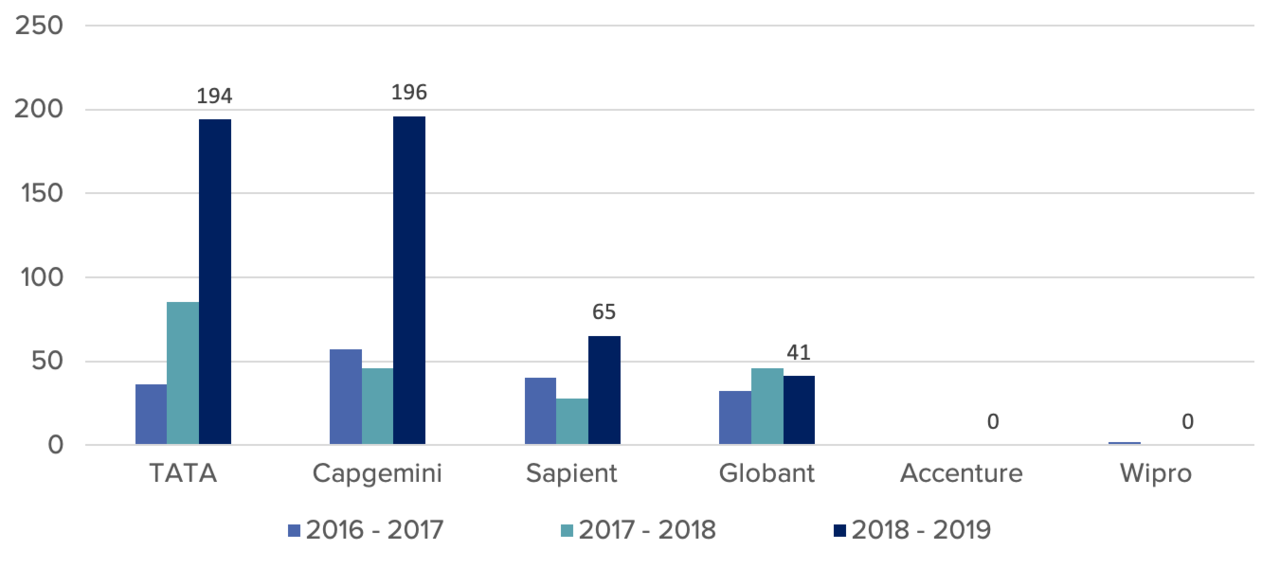
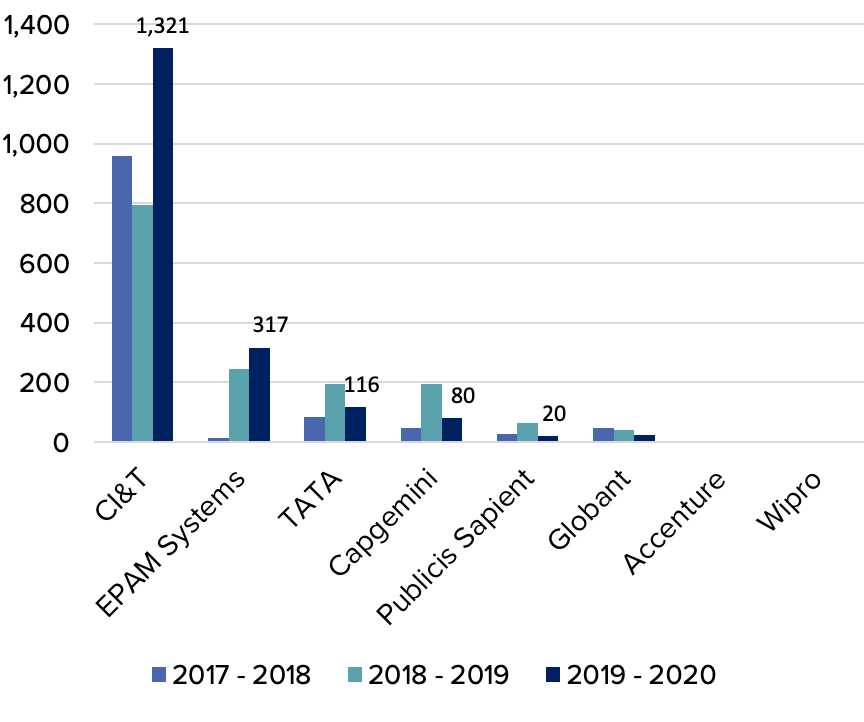
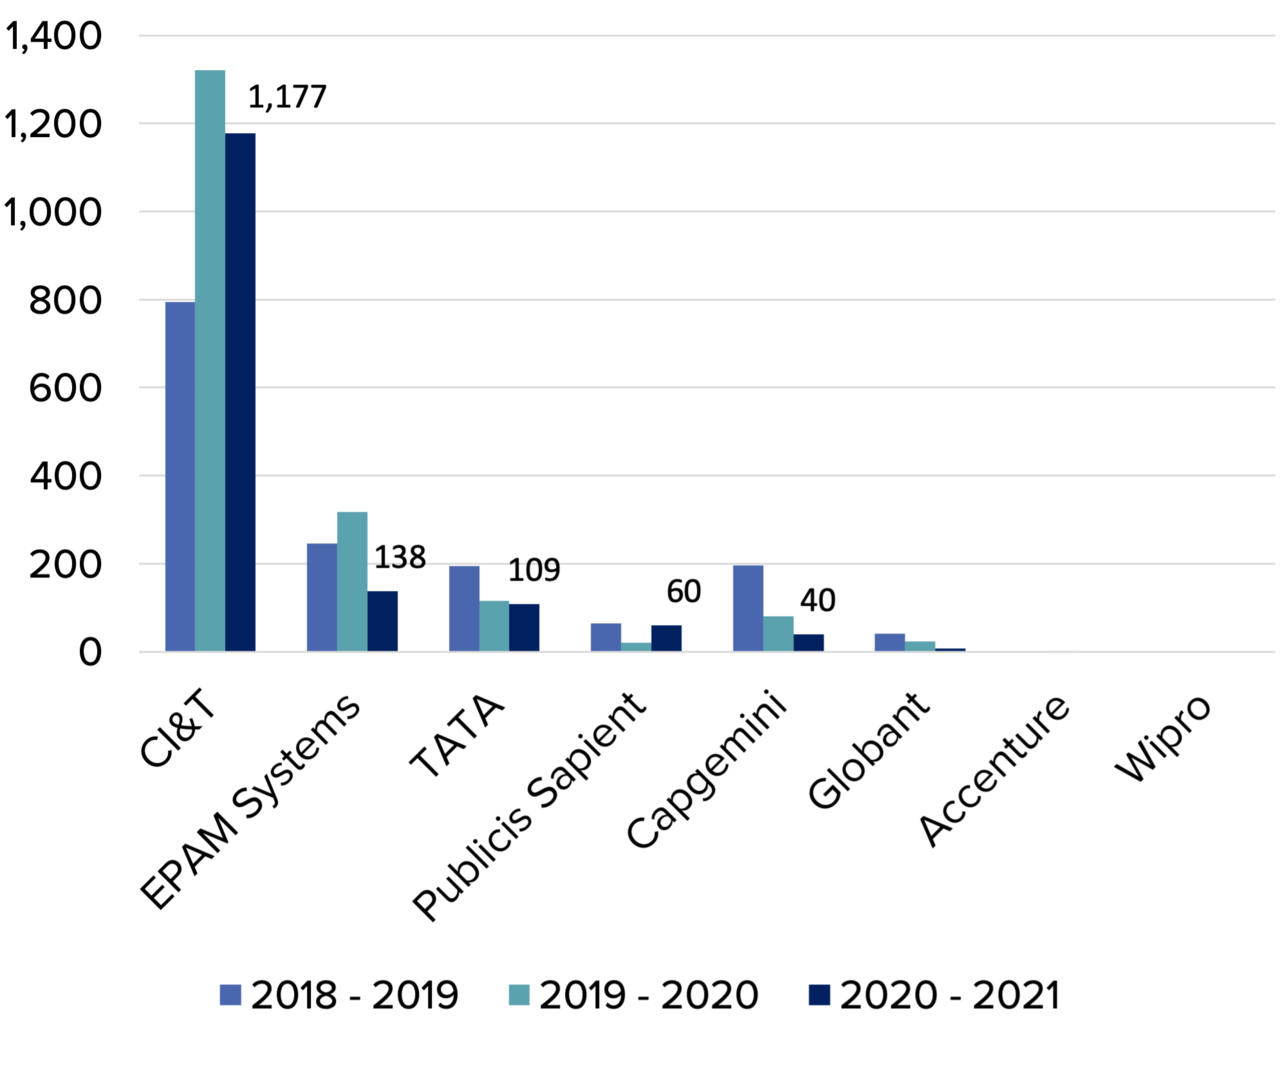
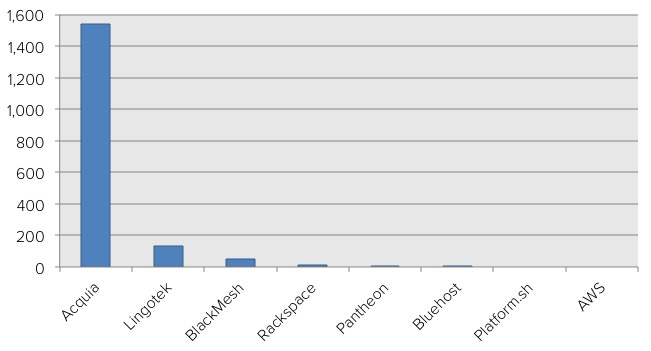
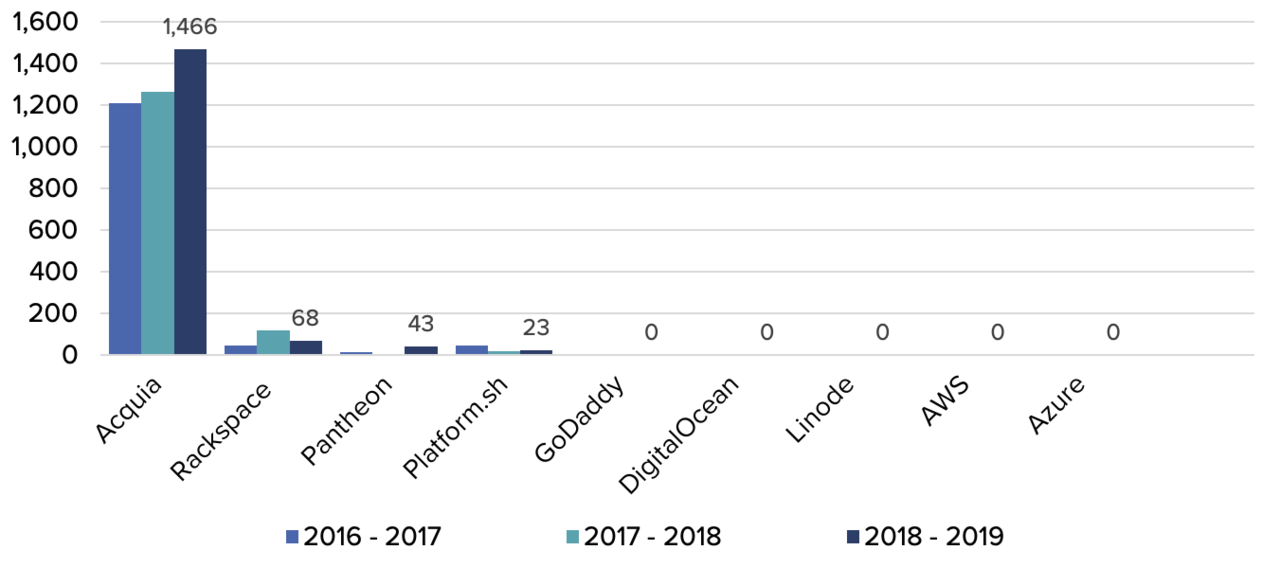
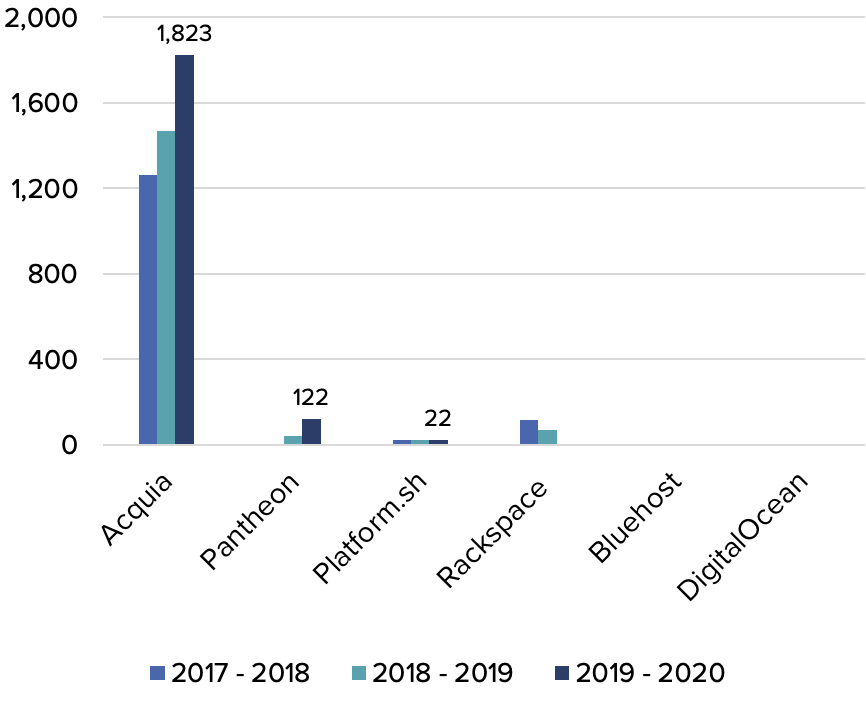
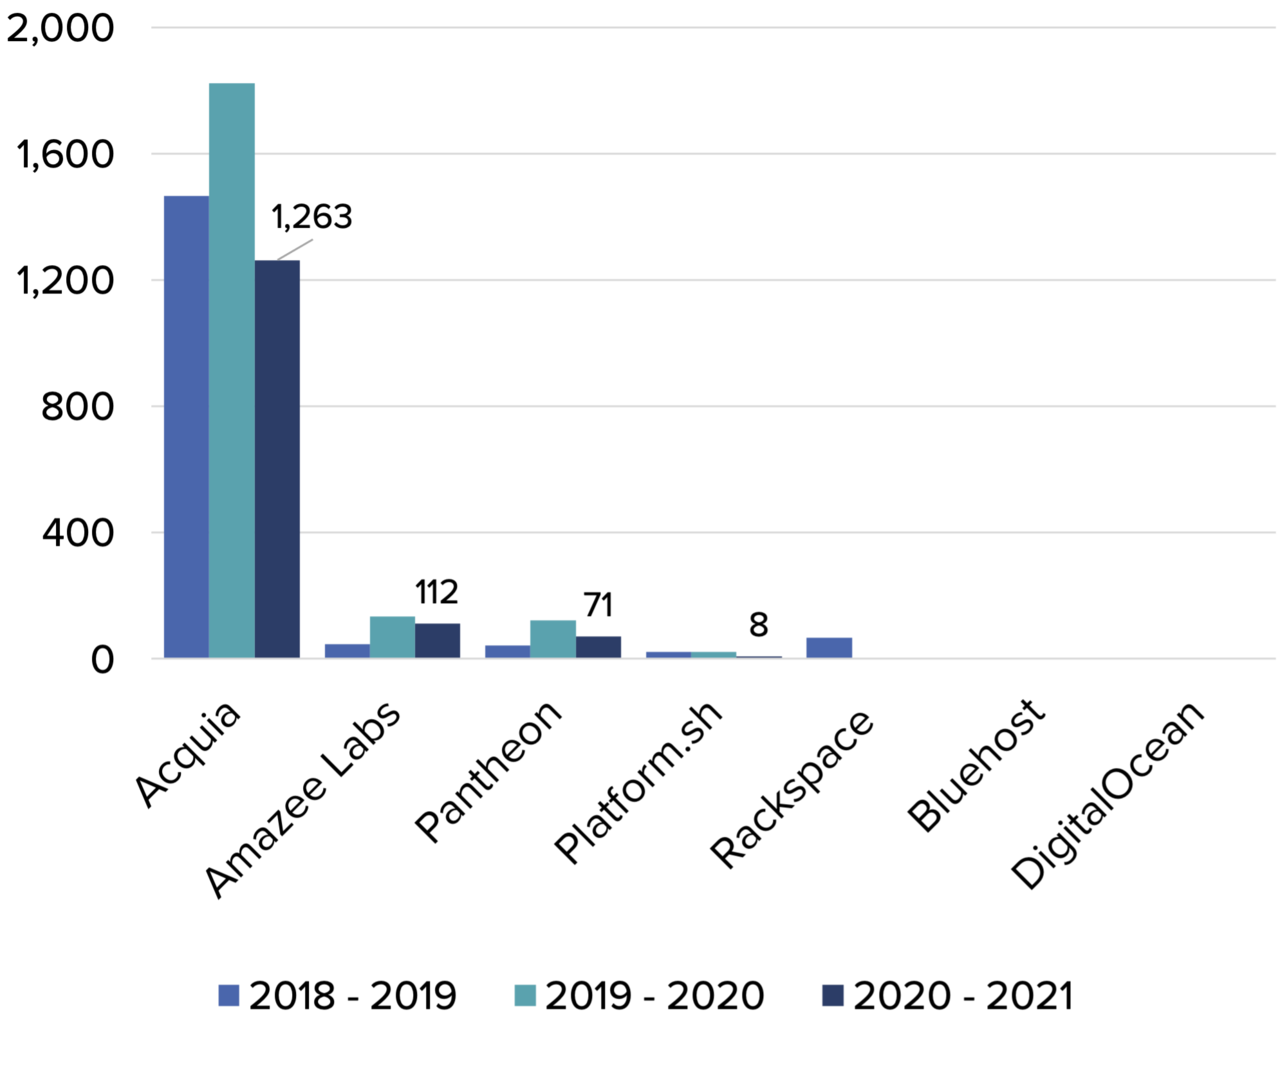
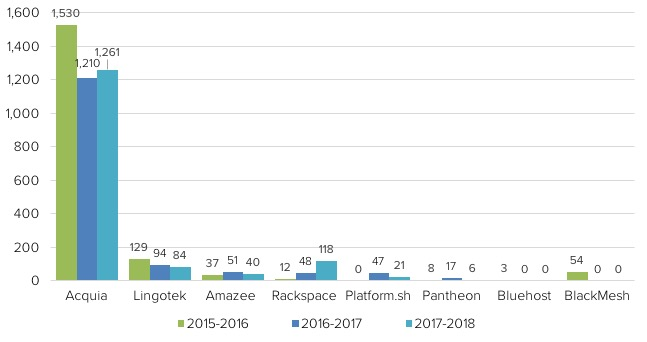
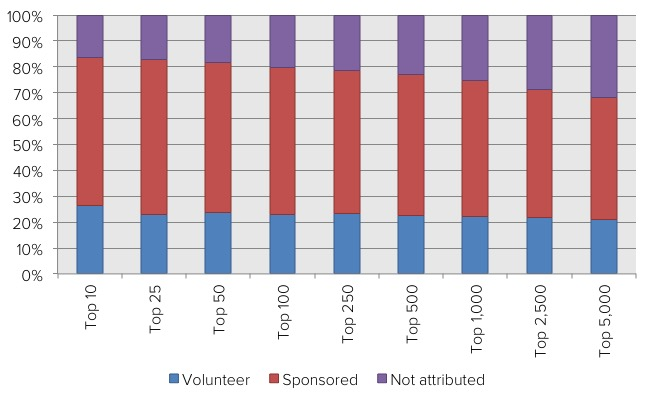
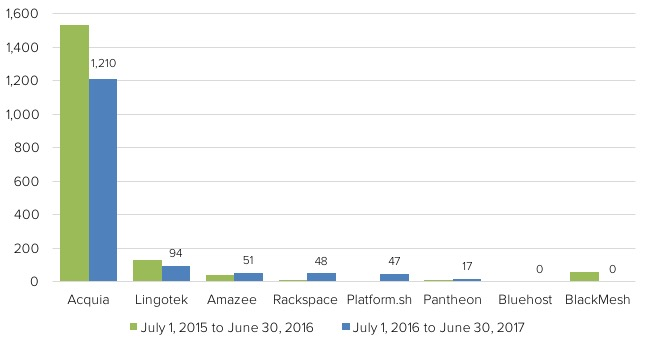 Sponsored code contributions to Drupal.org from technology and infrastructure companies. The chart does not reflect sponsored code contributions on GitHub, Drupal event sponsorship, and the many forms of value that these companies add to Drupal and other open-source communities.
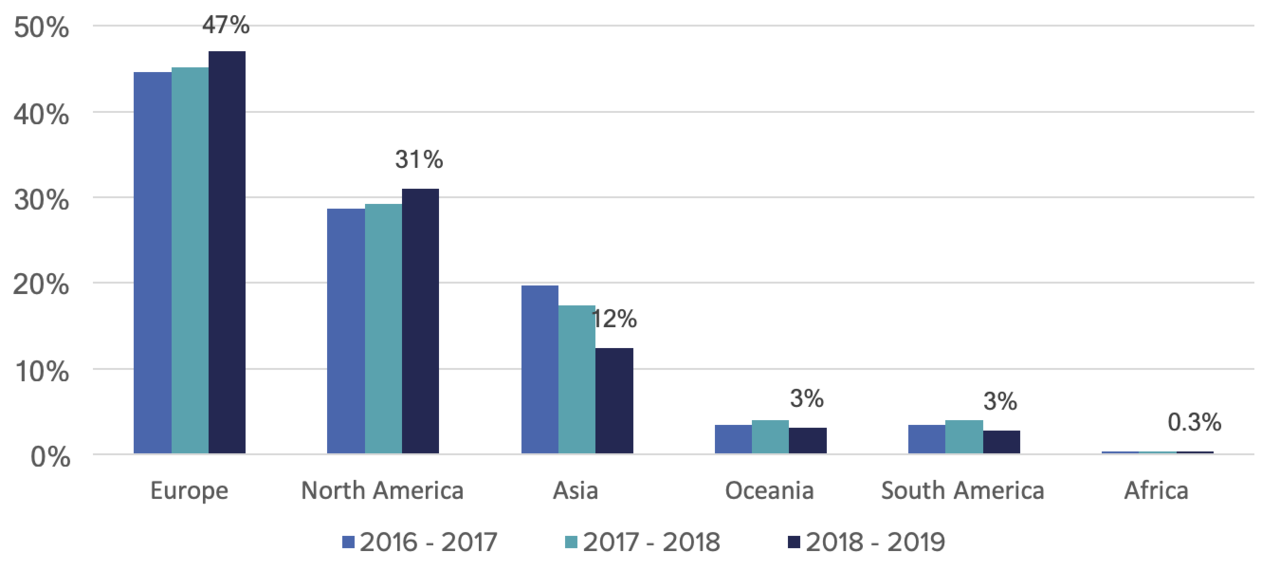
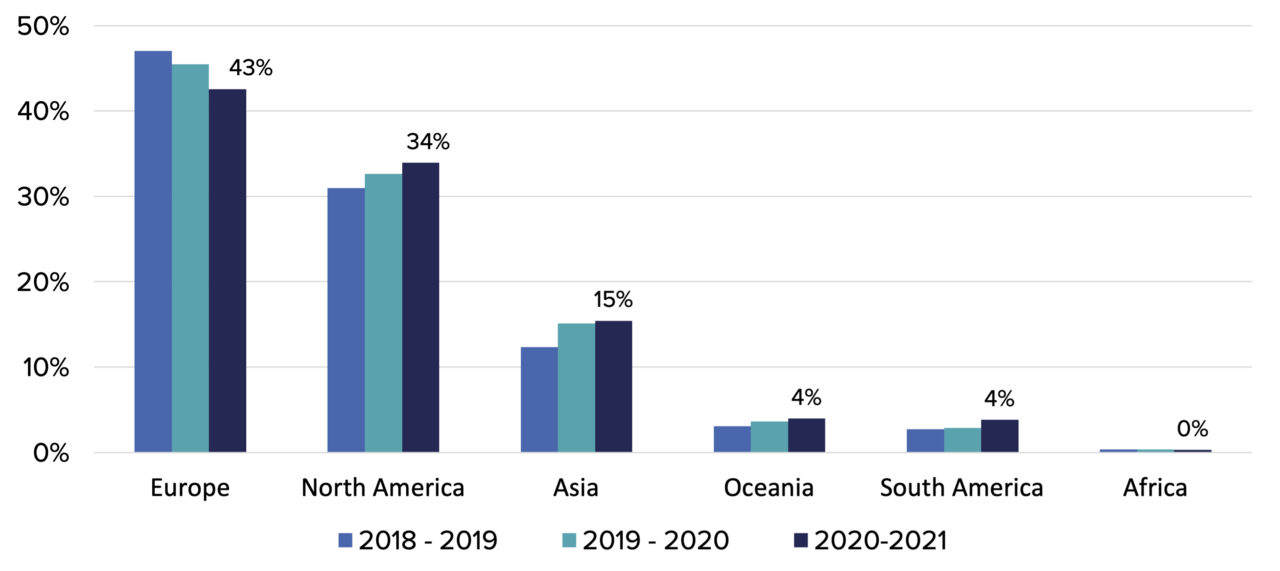
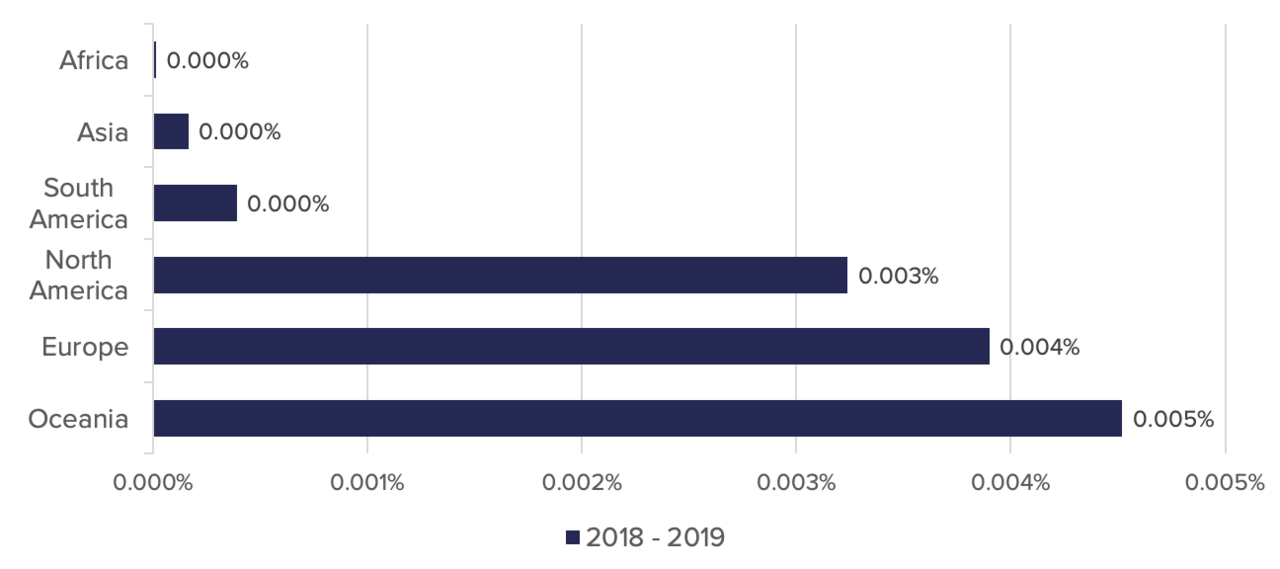 Contribution credits per capita calculated as the amount of contributions per continent divided by the population of each continent. 0.001% means that one in 100,000 people contribute to Drupal. In North America, 3 in 100,000 people contributed to Drupal the last year.
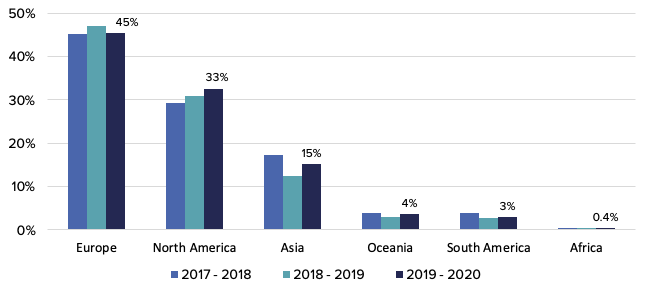
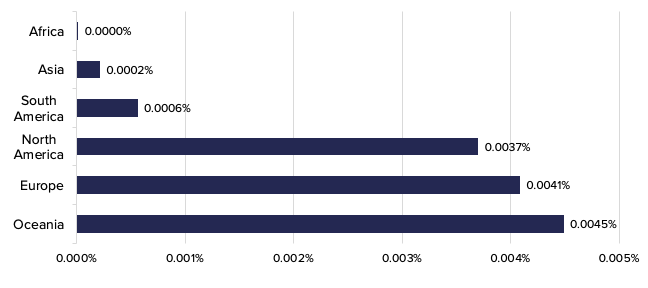 Contribution credits per capita calculated as the amount of contributions per continent divided by the population of each continent. 0.001% means that one in 100,000 people contribute to Drupal. In North America, almost 4 in 100,000 people contributed to Drupal the last year.
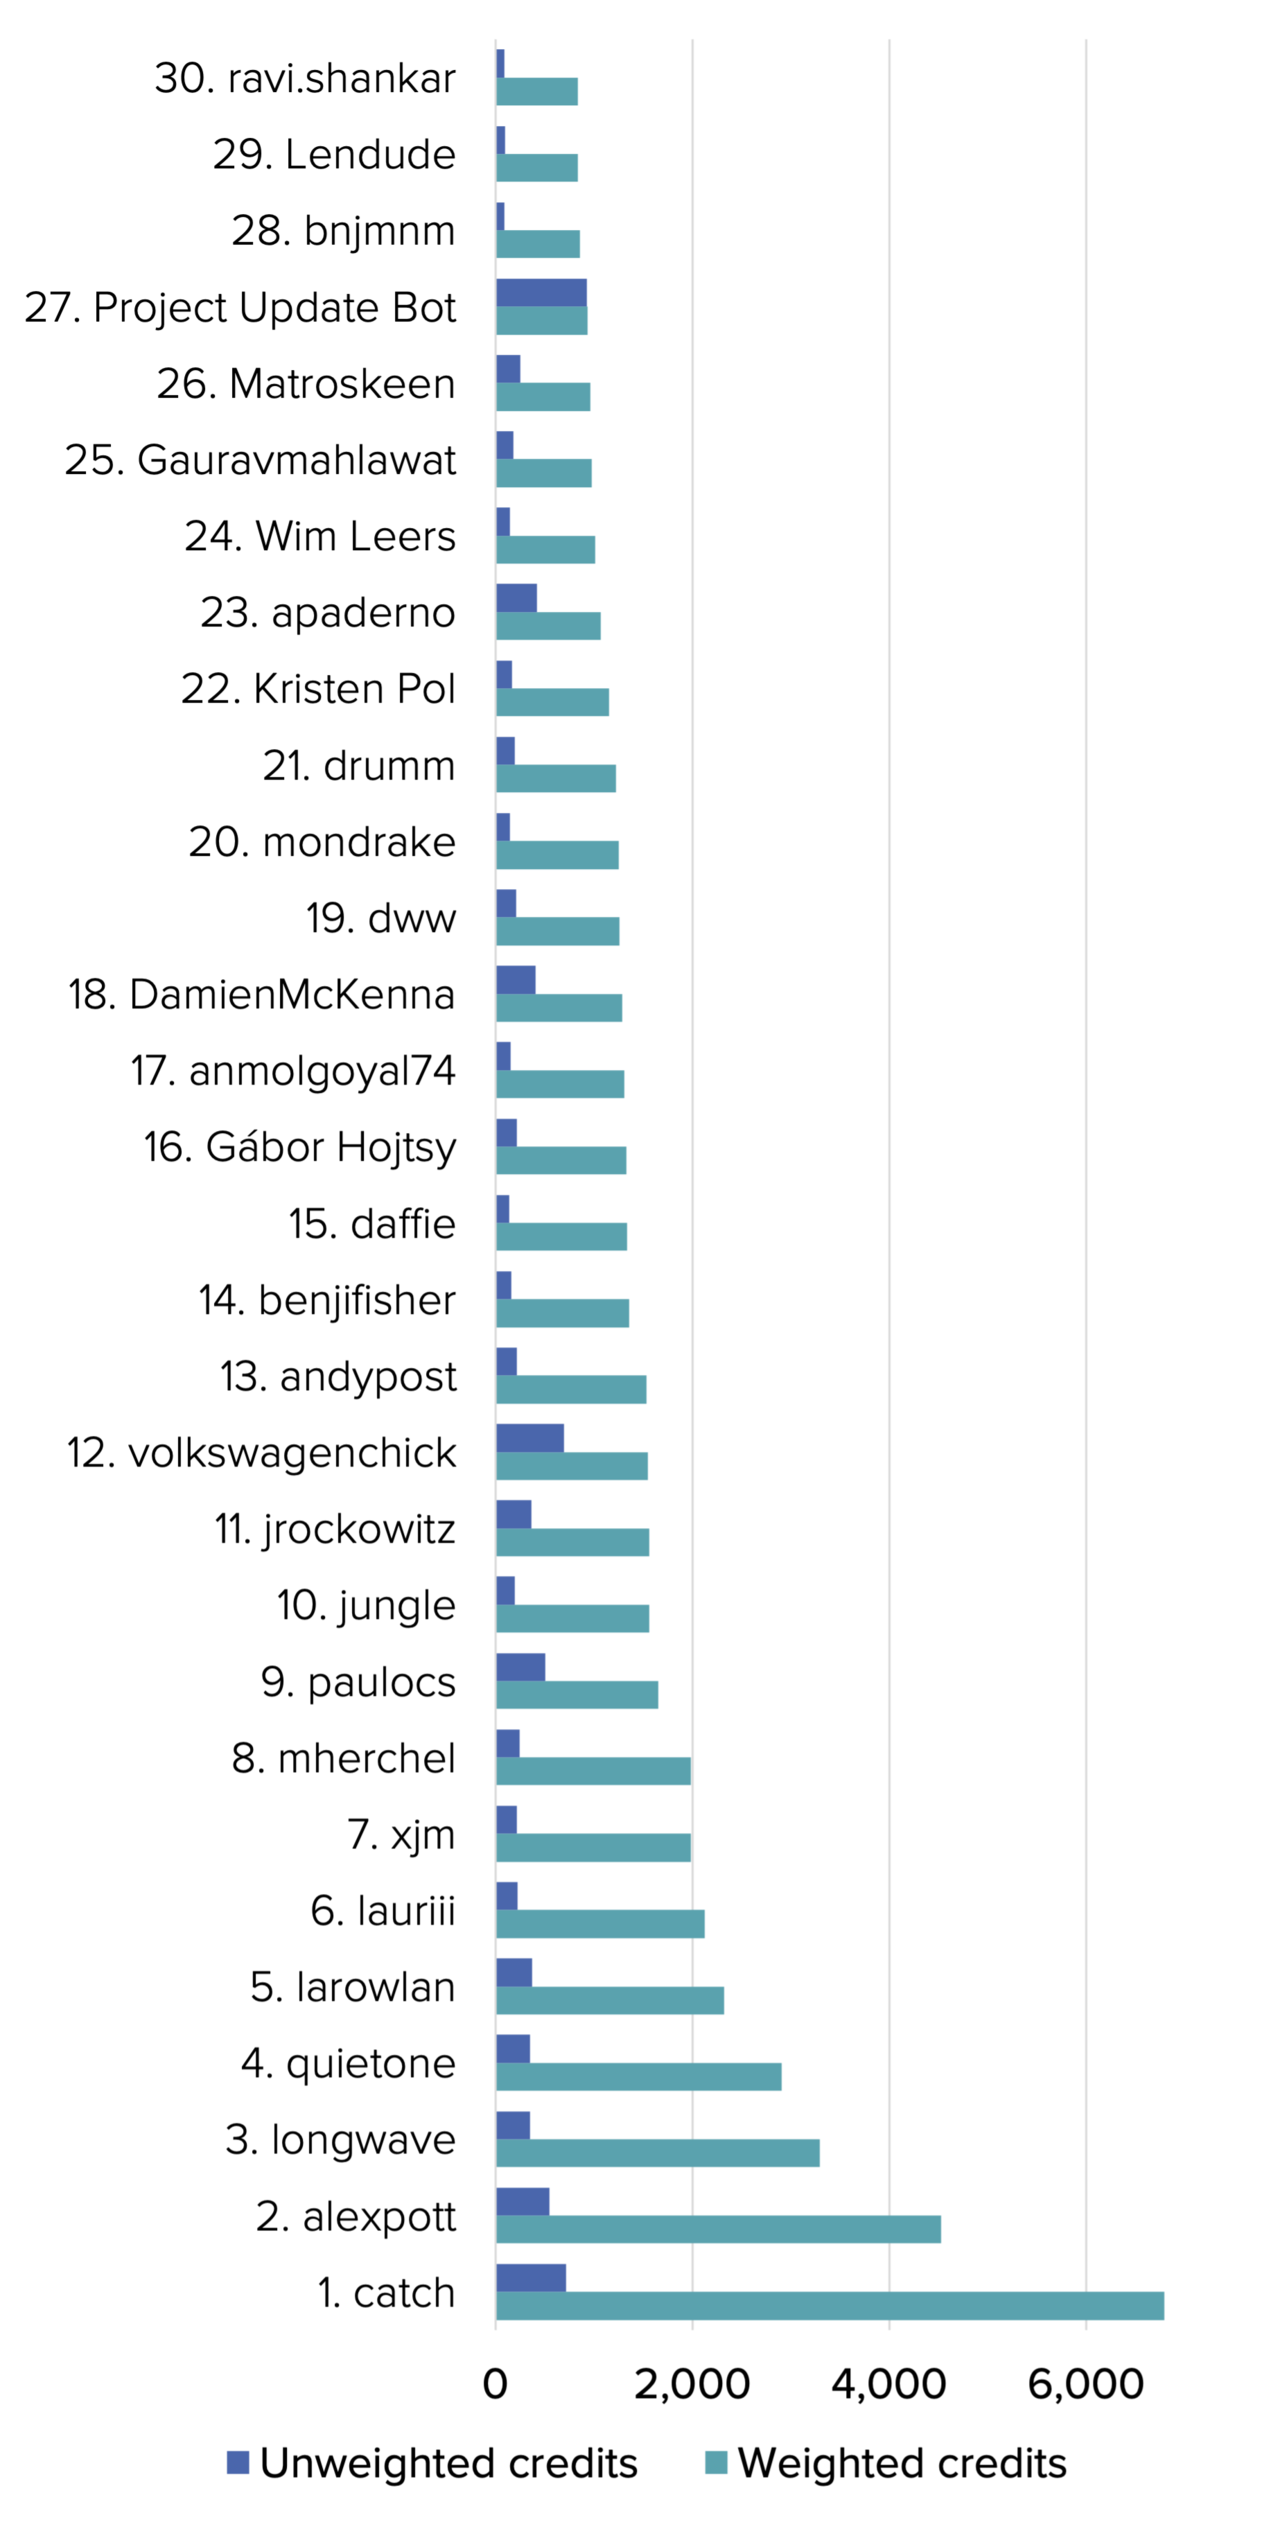
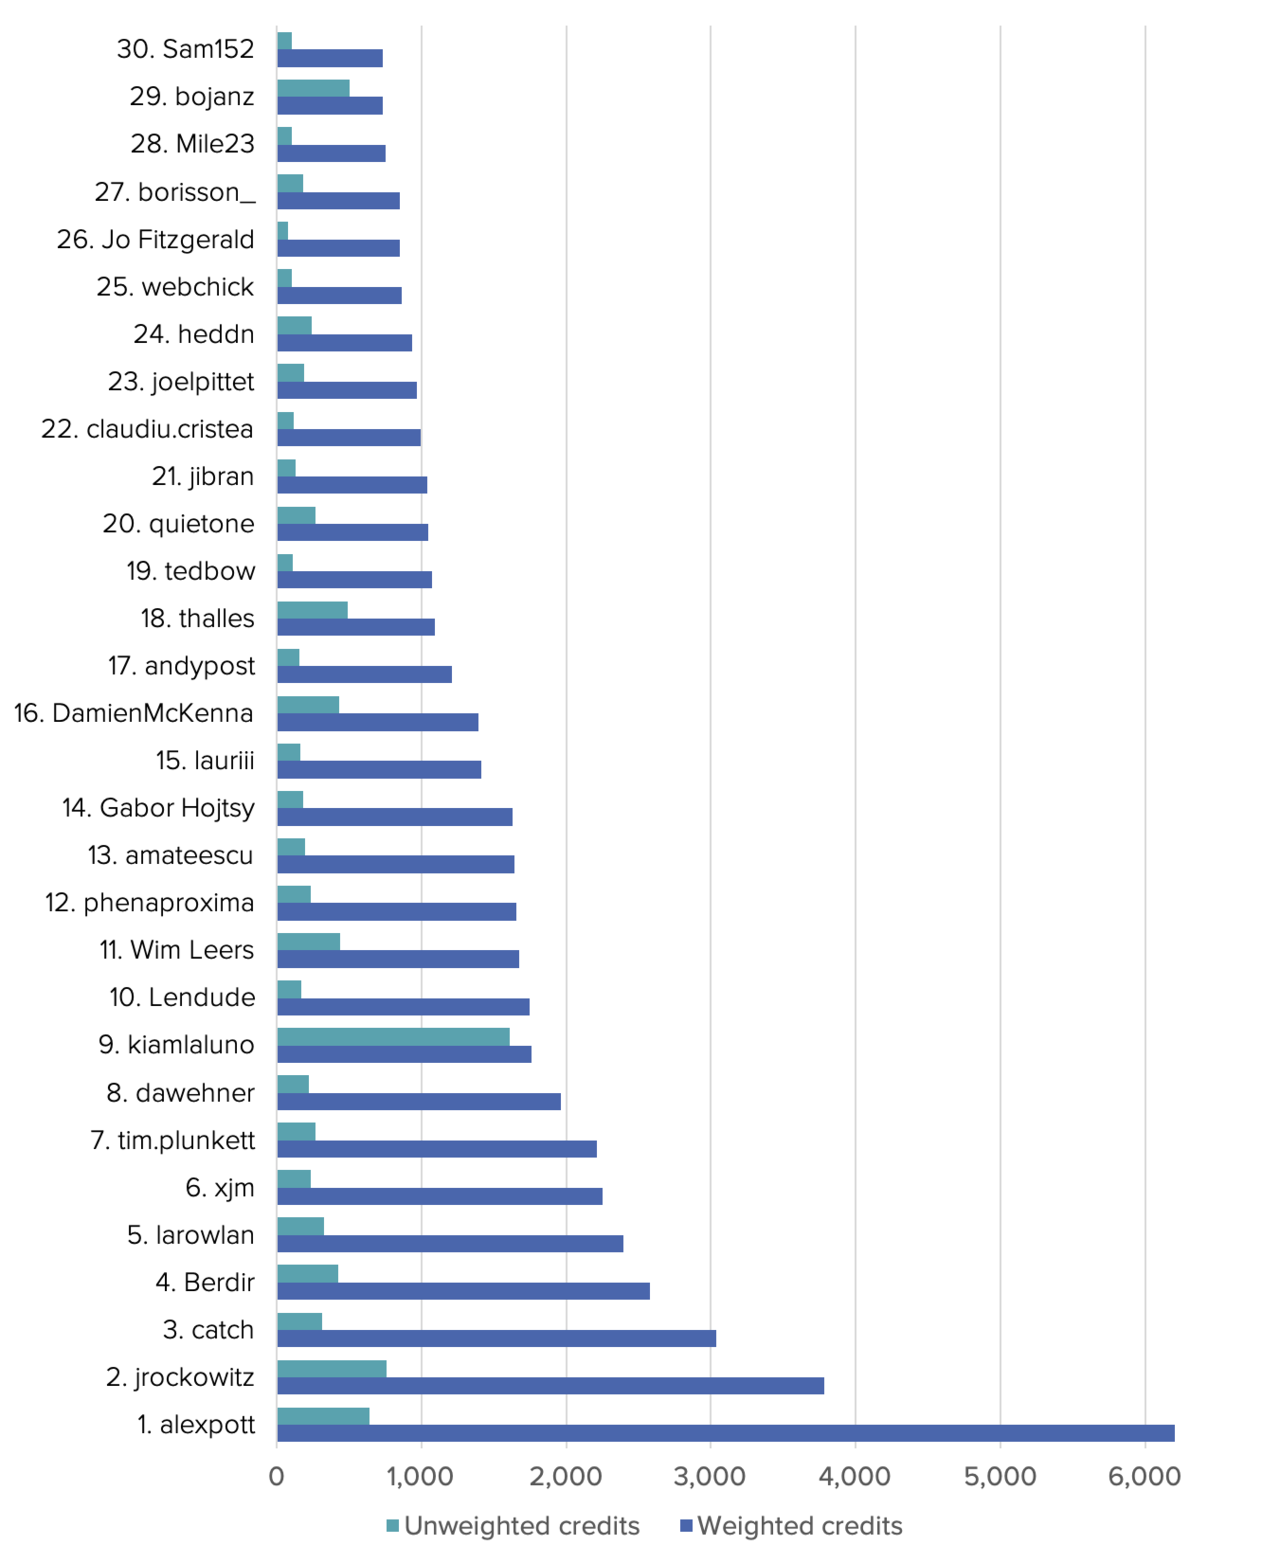 The top 30 contributing individuals based on weighted Drupal.org issue credits.
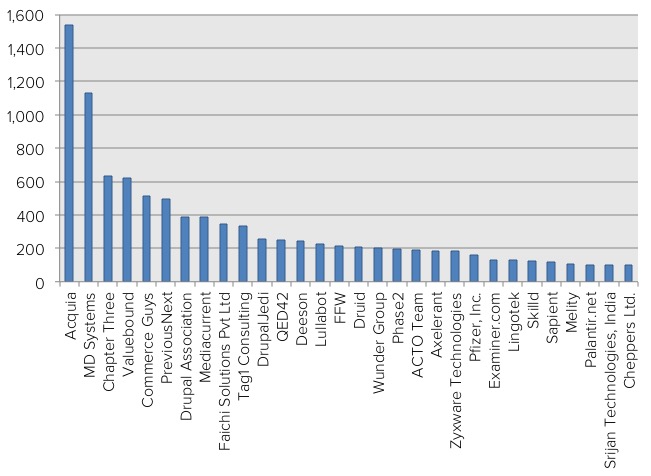
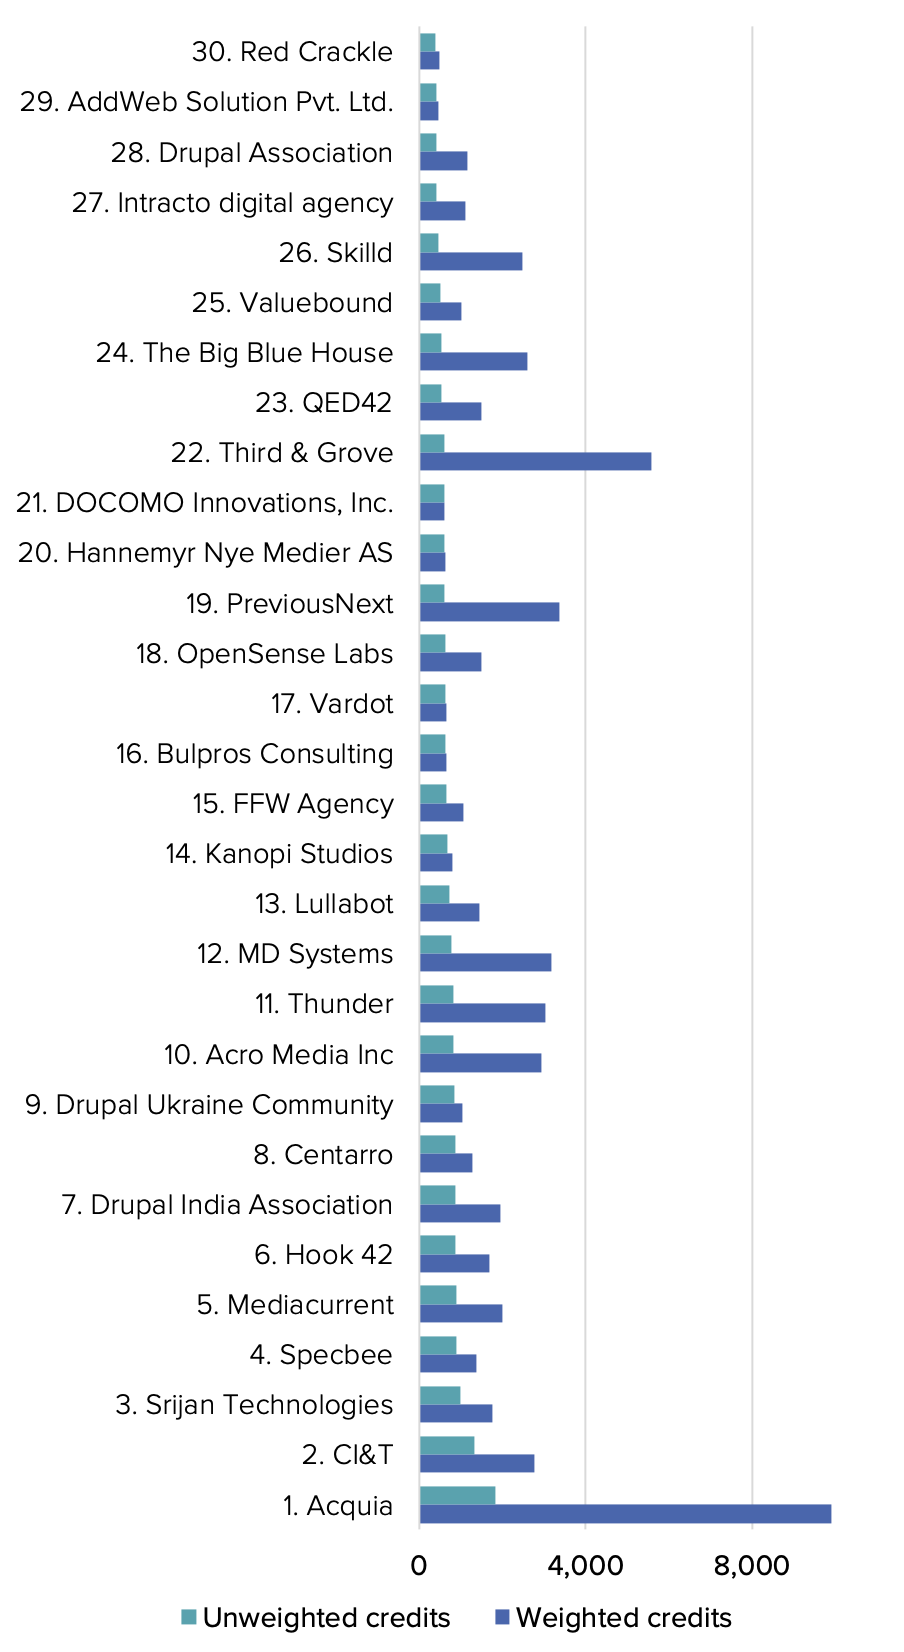
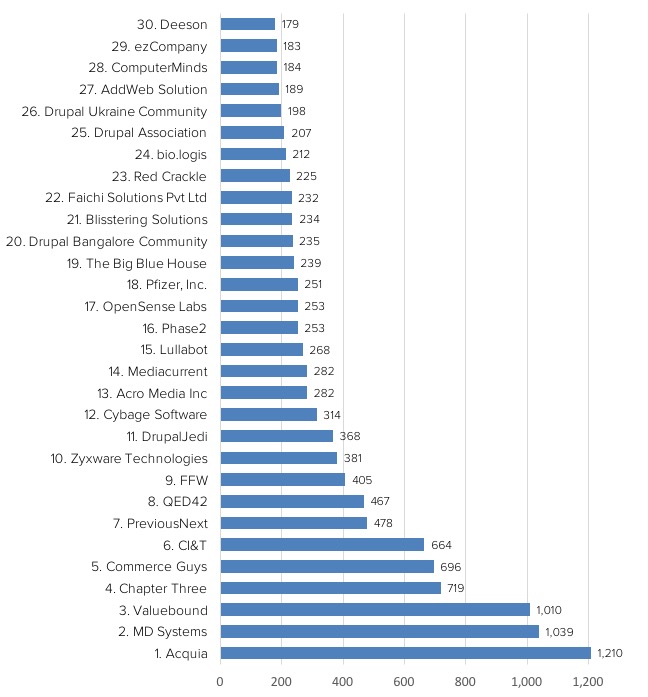 The top 30 contributing organizations based on the number of Drupal.org commit credits.
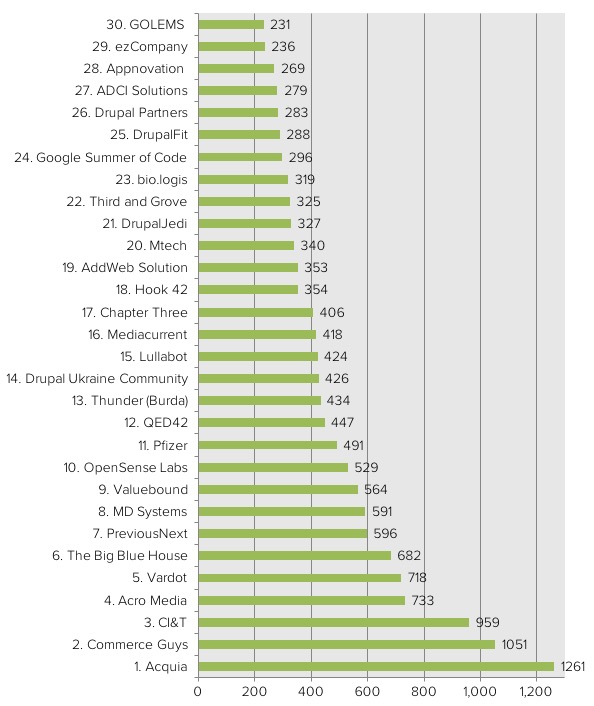 The top 30 contributing organizations based on the number of Drupal.org commit credits.
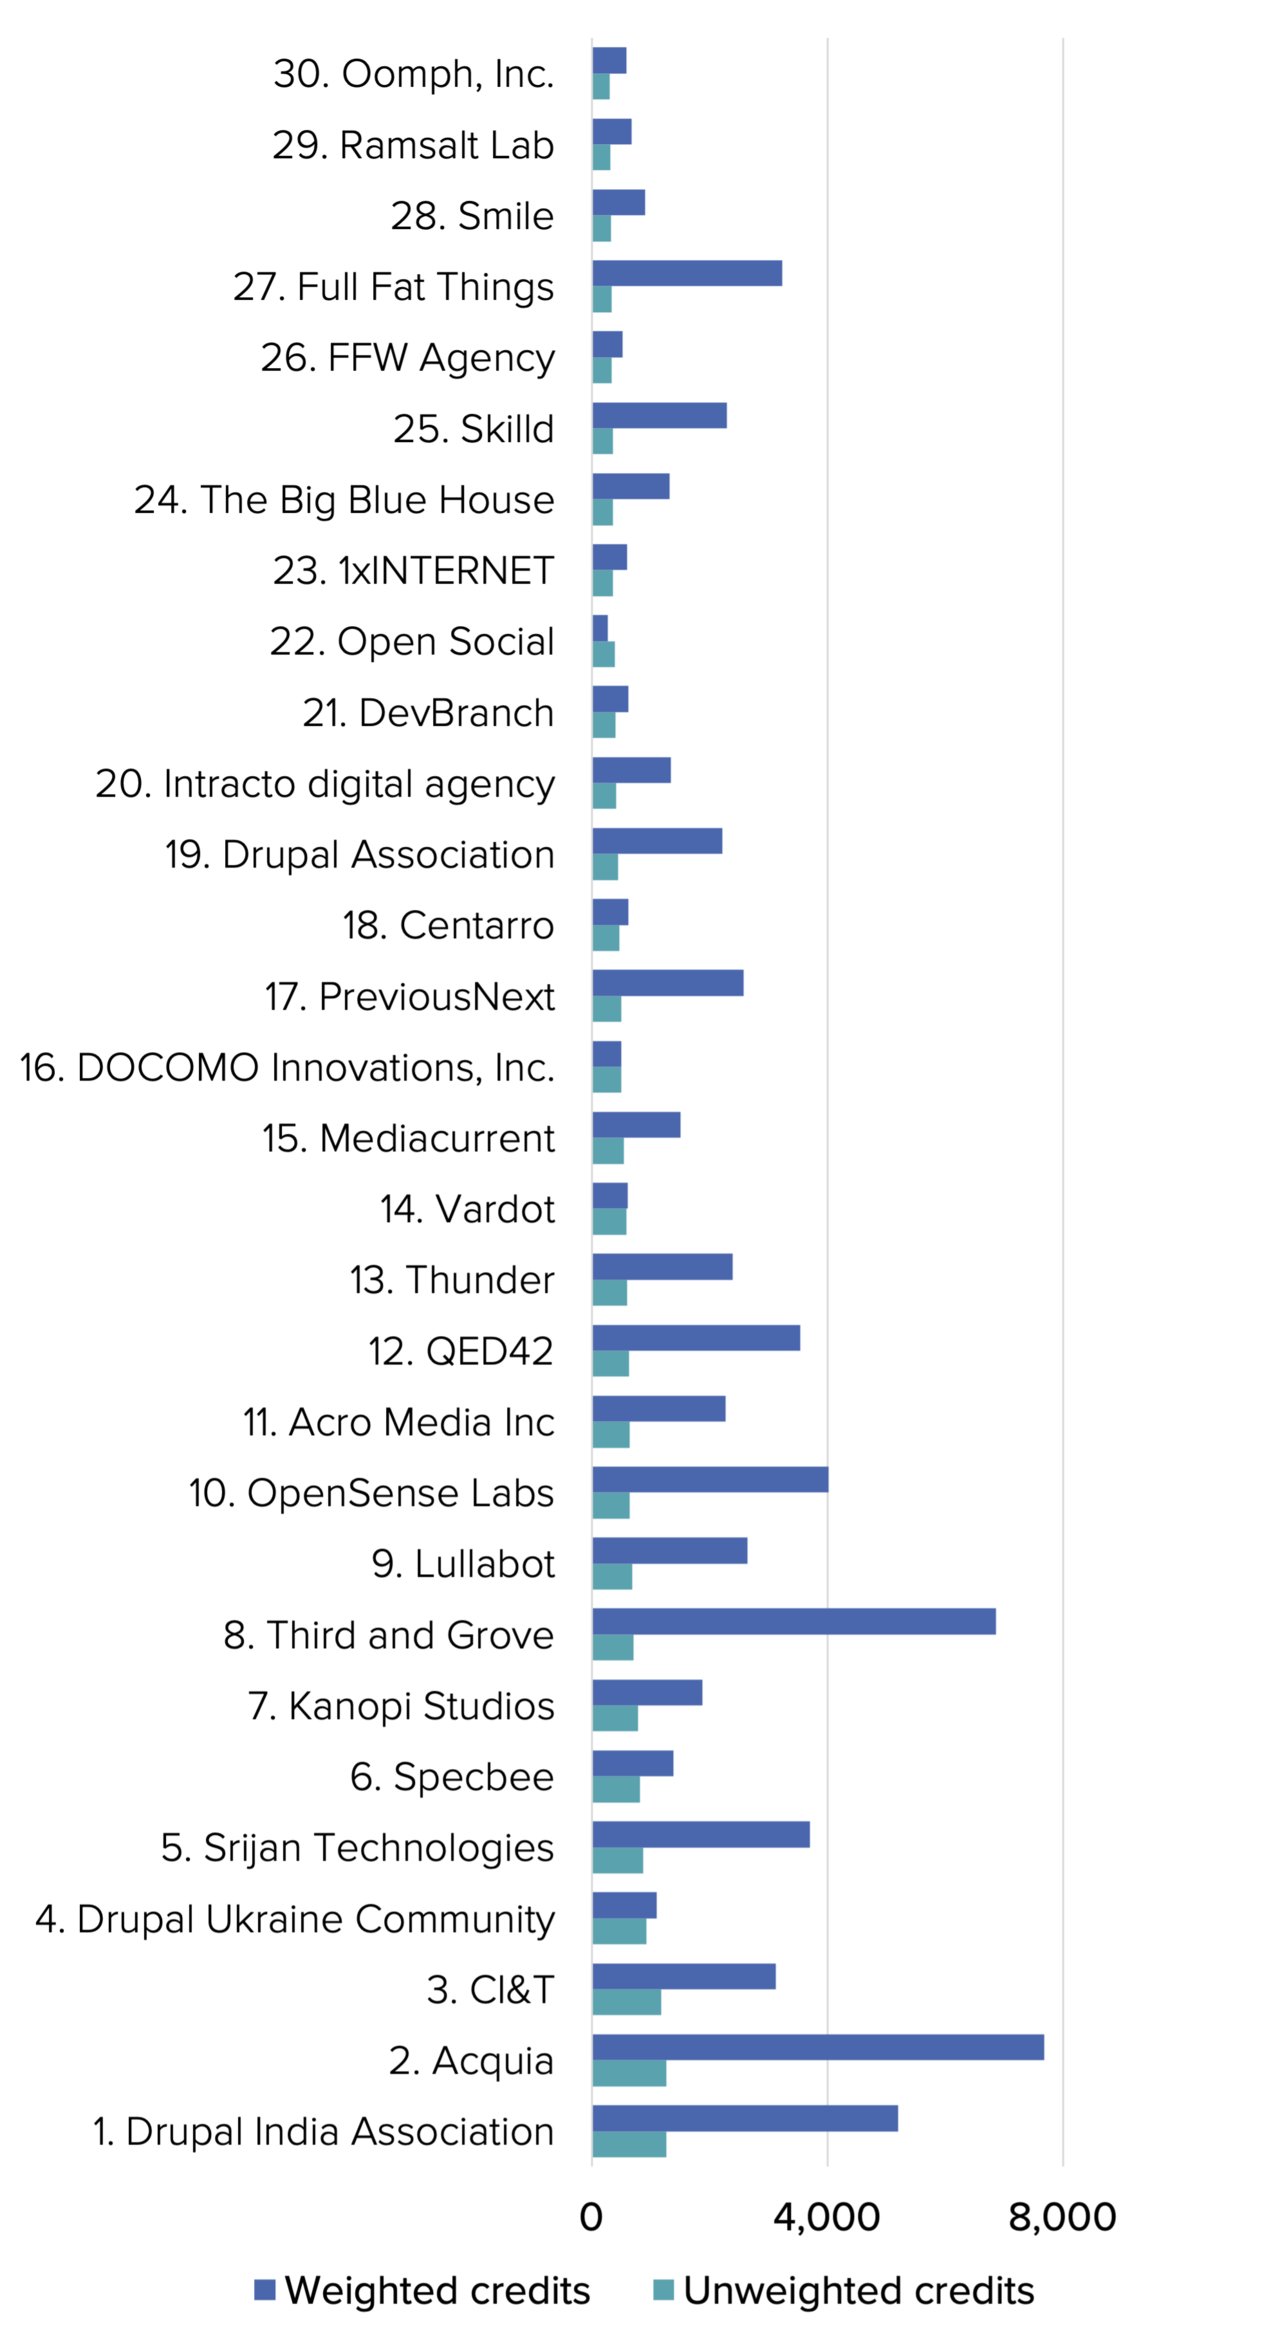
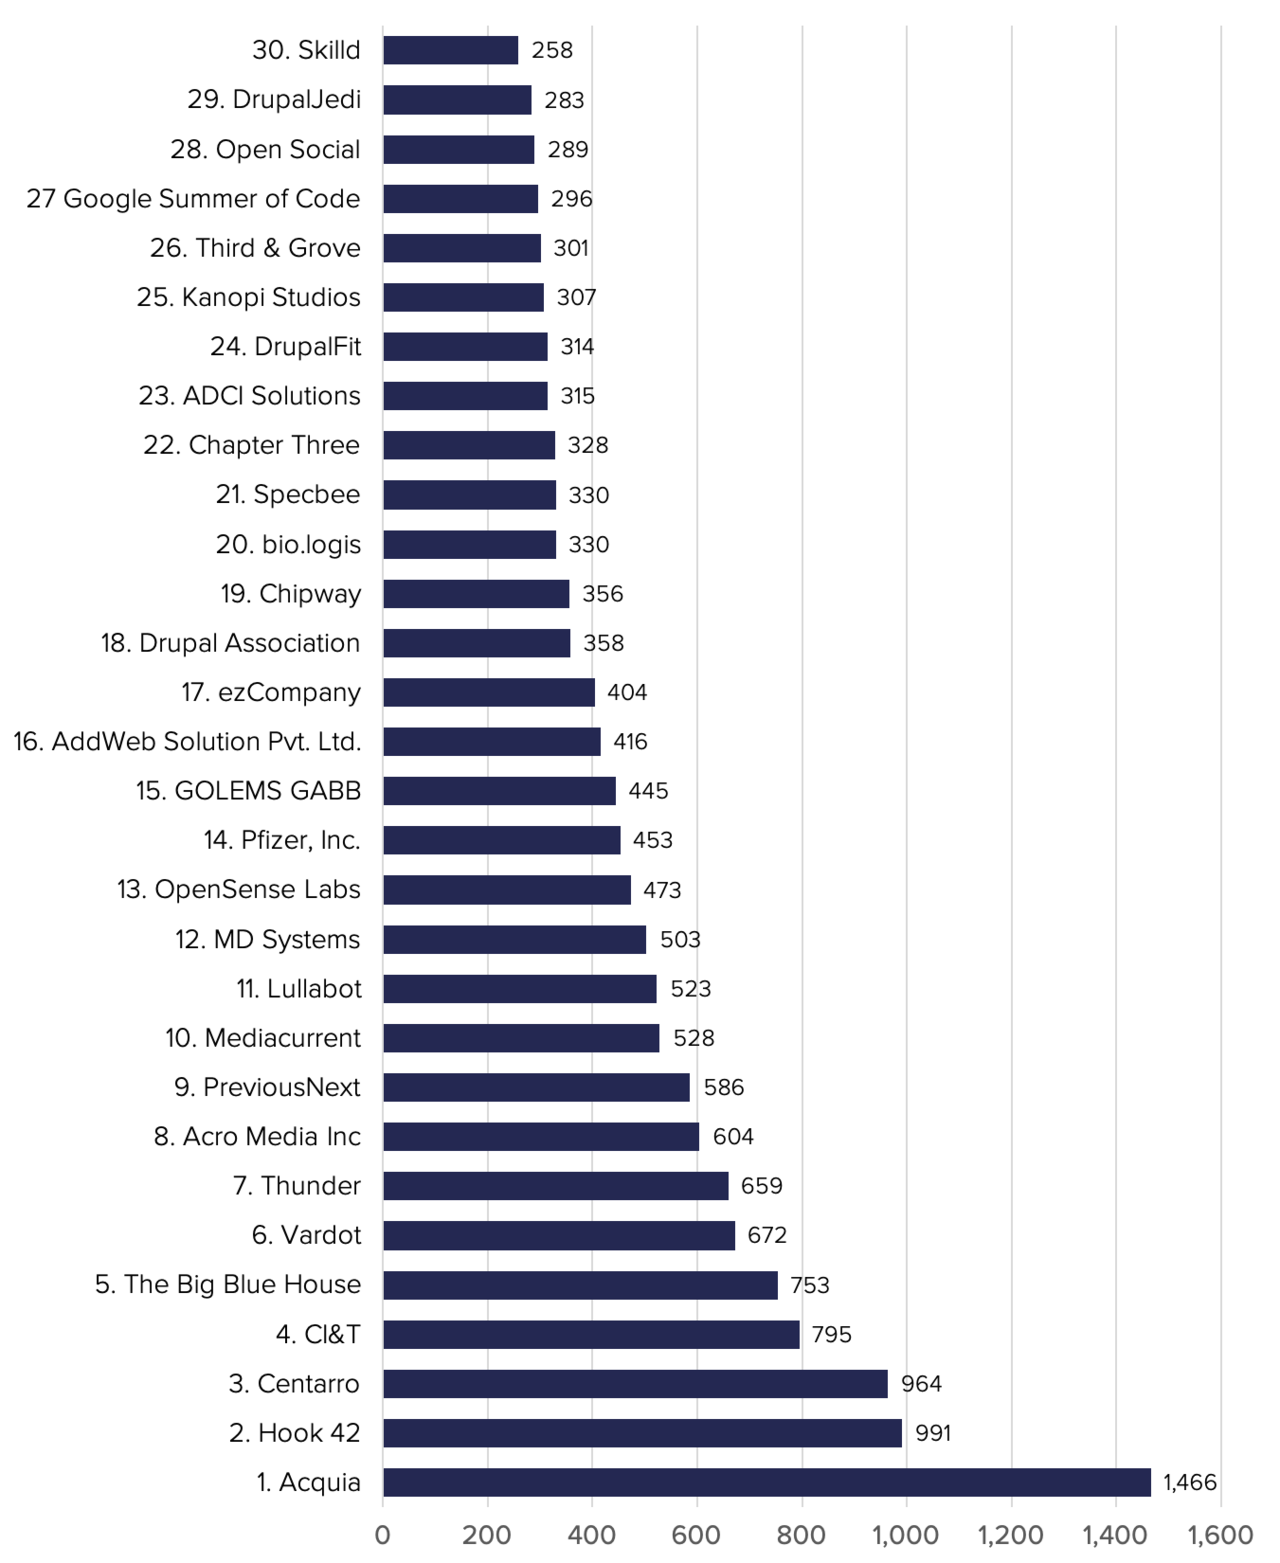 Top contributing organizations based on the number of issue credits.
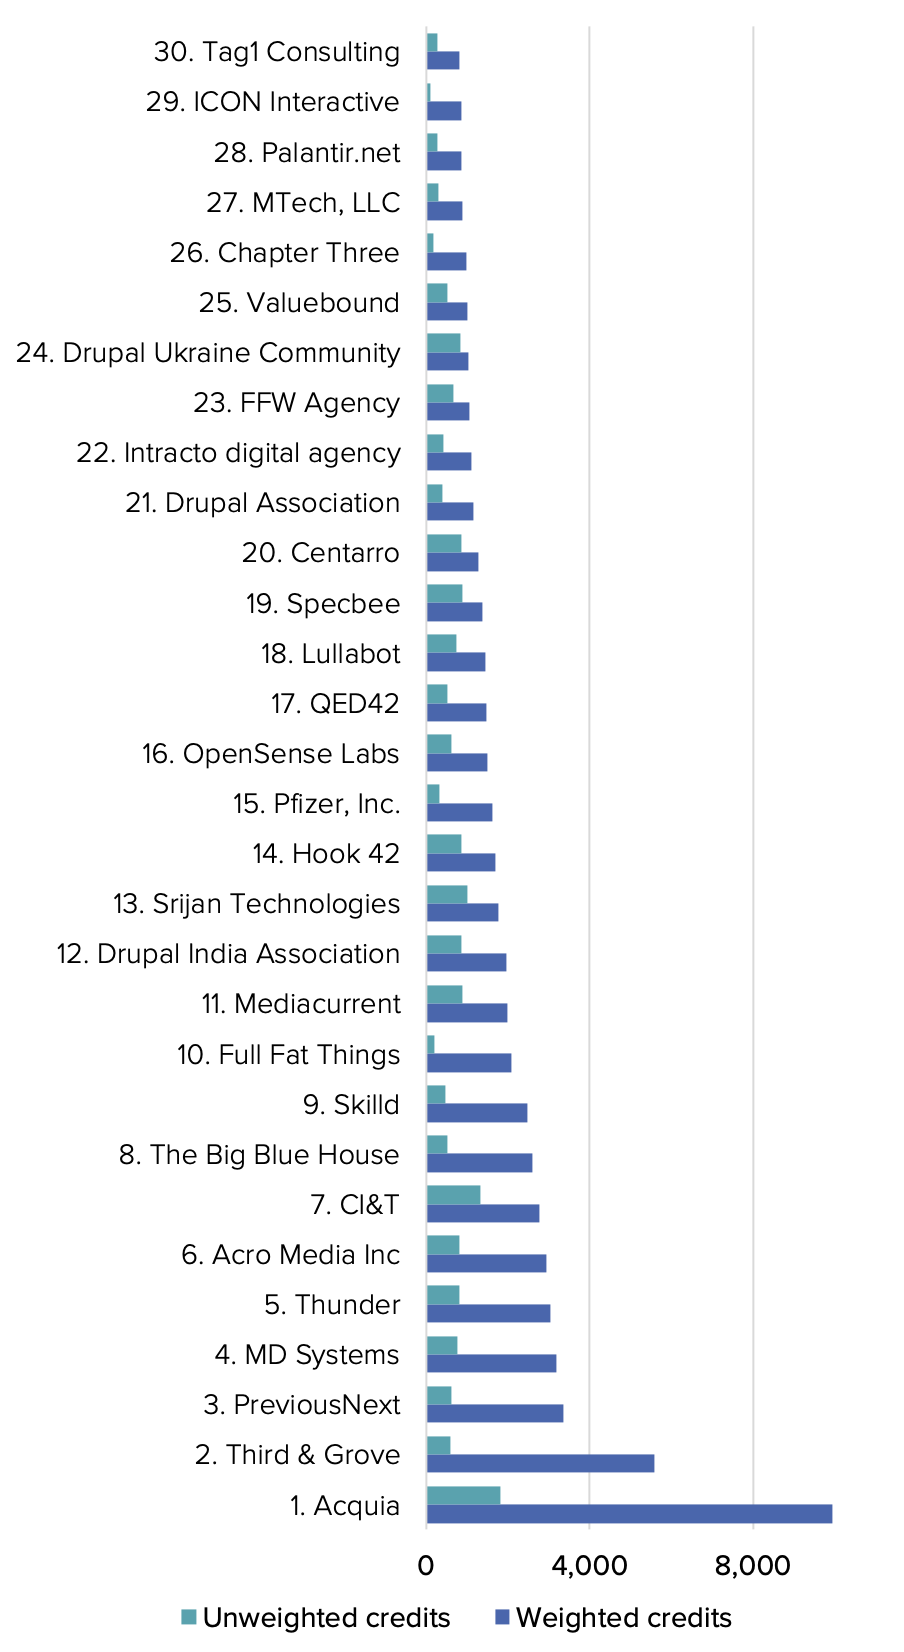
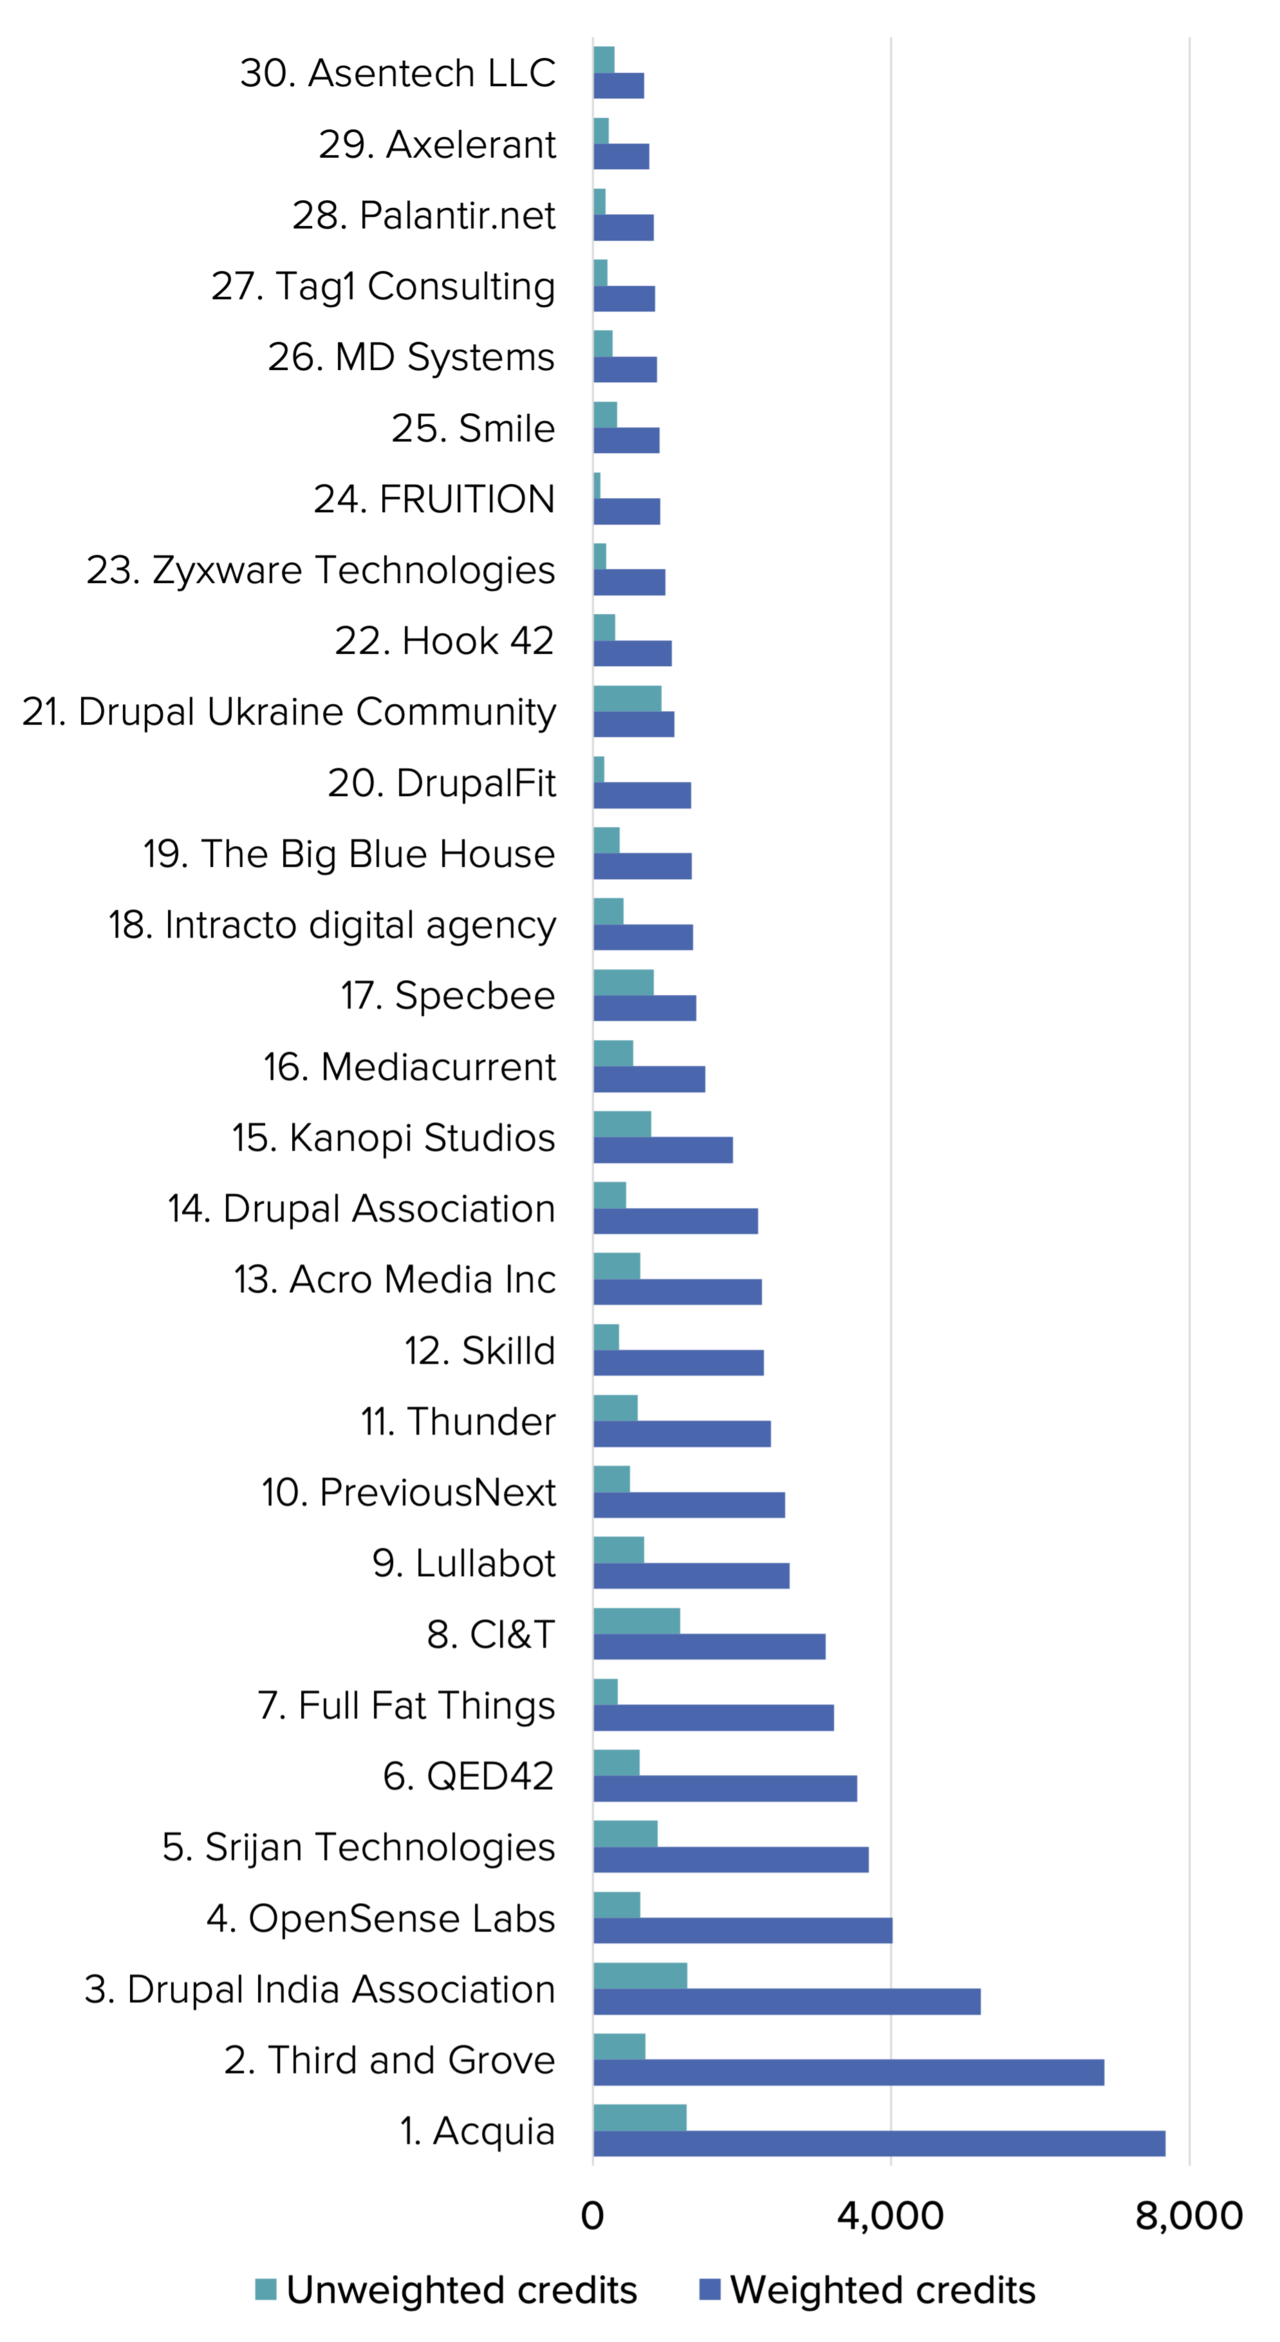
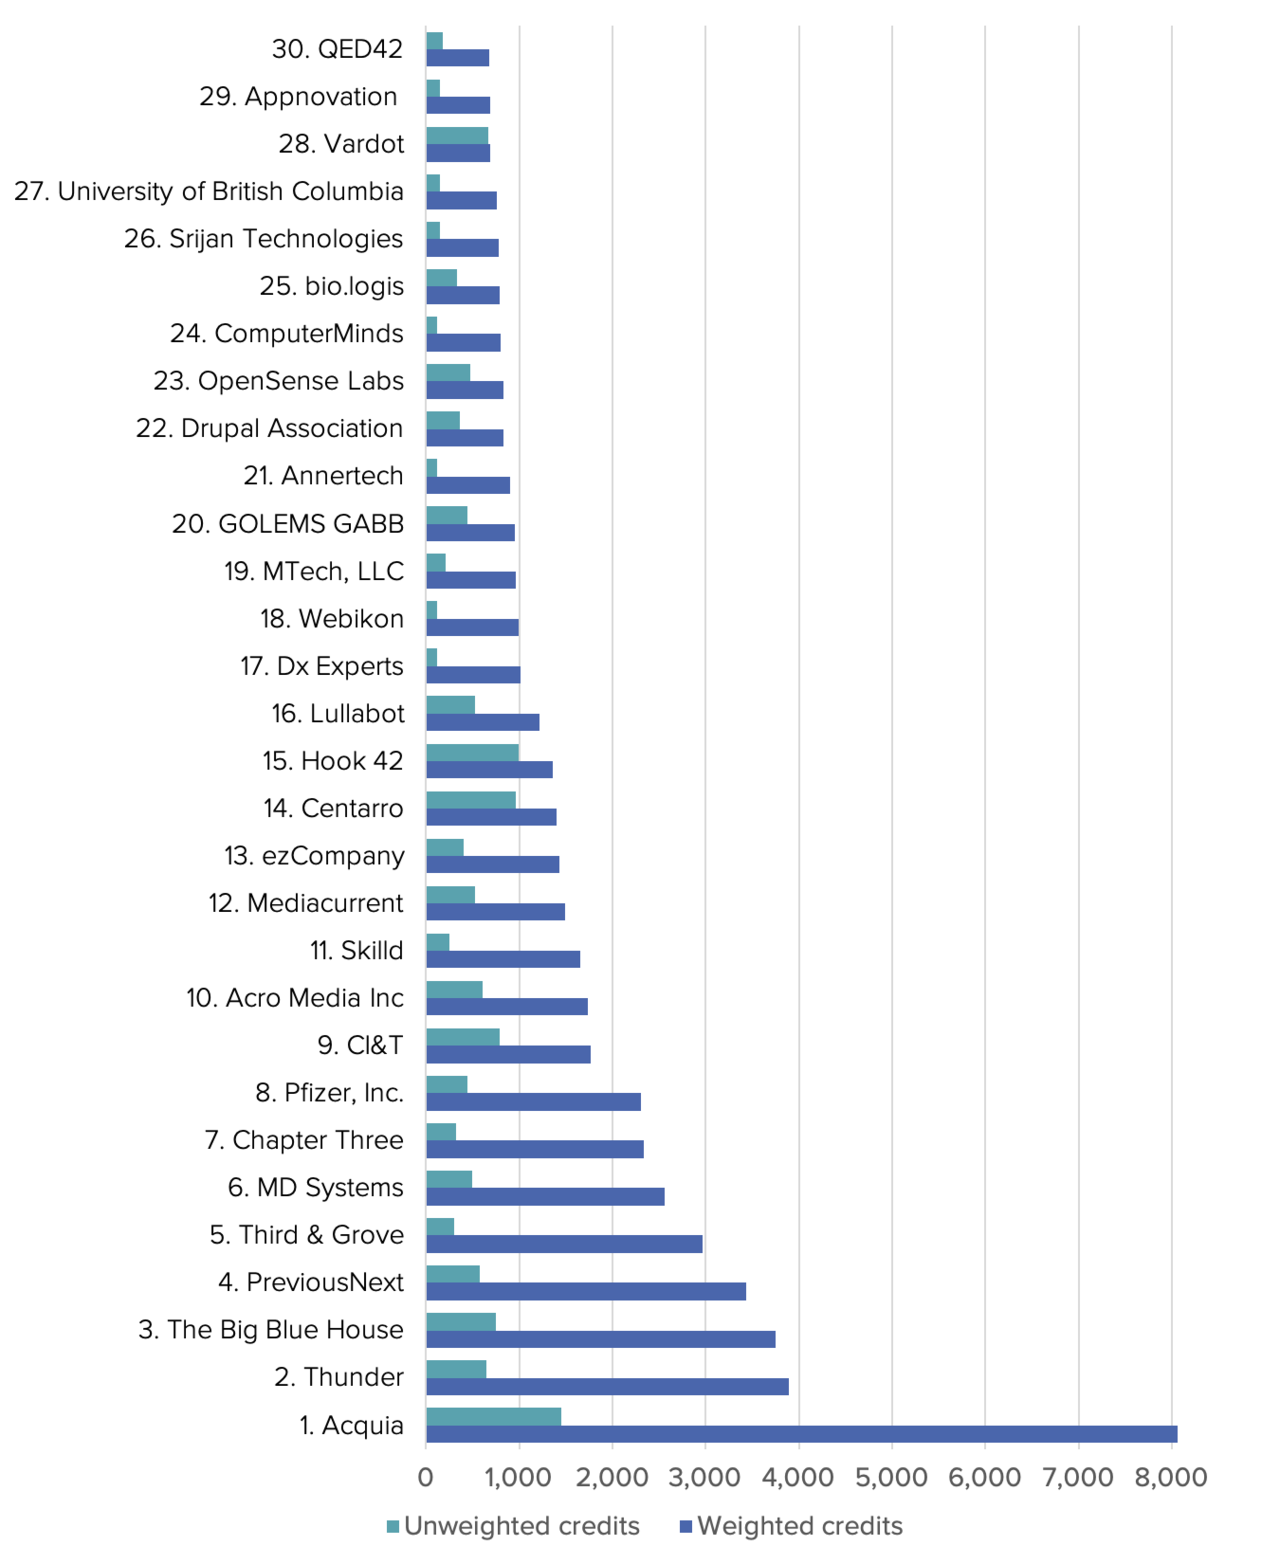 The top 30 contributing organizations based on weighted Drupal.org issue credits.

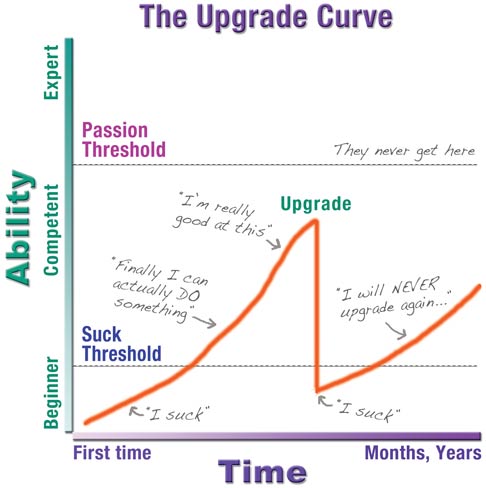 The problem with disruptive upgrades. People don't upgrade because they don't want to move back into the "suck zone". You have to make it easy to upgrade because users will remember the pain of this upgrade when it comes time for the next one. An upgrade should be worth it so you need a good balance between "upgrade pain" and "added value". (Taken from Why they don't upgrade (and what to do about it)). © Kathy Sierra.
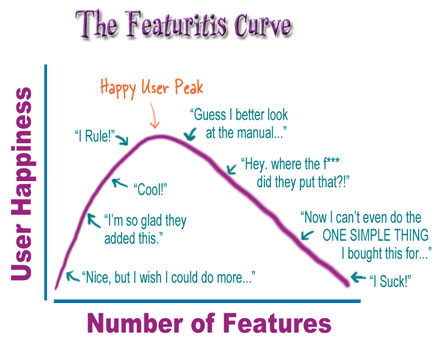 Don't give in to "featuritis" and be the "I rule" product, not the "This thing I bought does everything, but I suck!" product. (Taken from Featuritis verus the Happy User Peak.) © Kathy Sierra.
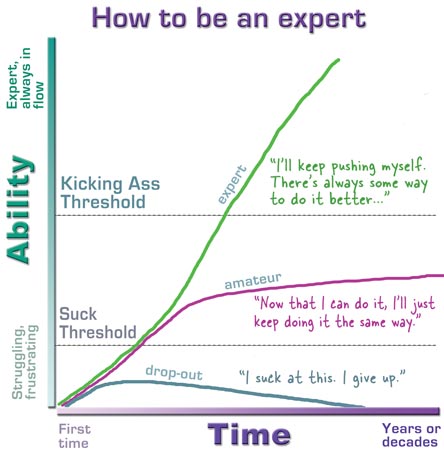 Users will typically fall into one of the three categories: expert, amateur, or drop-out. The drop-outs decide that during that "I suck at this" phase, it isn't worth continuing. They give up. The amateur made it past the suck threshold, but now they don't want to push for new skills and capabilities. They don't want to suck again. They'll never get past the kick-ass threshold where there is a much greater chance they'll become passionate. (Taken from How to be an expert.) © Kathy Sierra.
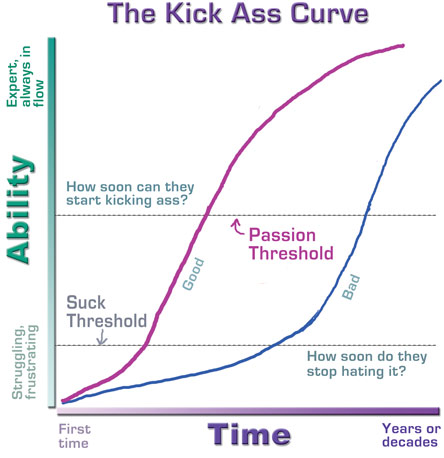 The goal of a software application is to get users up the curve as quickly as possible. People get passionate if you help them kick ass with your product. The "time to stop sucking" and "time to first kick-ass" quotients are among the biggest advantages we have in a world where the competition is both fierce and plentiful. Get your users up there faster, and you win. More importantly, it's a way in which we can make a positive impact on the lives of users. (Taken from Attenuation and the suck threshold.) © Kathy Sierra.
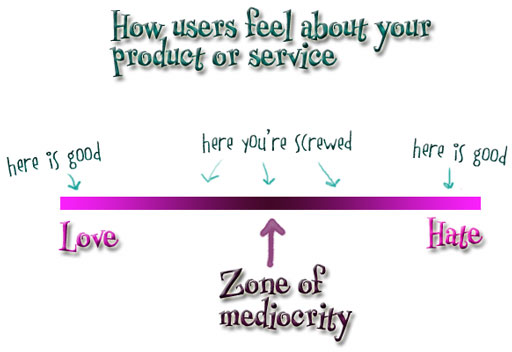 The more successful the product or service is, the stronger the pressure to give in to user requests. The more users you have, the more diverse the requests. The worst thing we can do is give in. We have to listen to our users but resist. The overwhelming pull of that right (hate) side slides you closer and closer to the middle. Those who hate it will hate it until you've neutered it into submission and taken away the magic some once loved. (Taken from Don't give in to feature demands.) © Kathy Sierra.
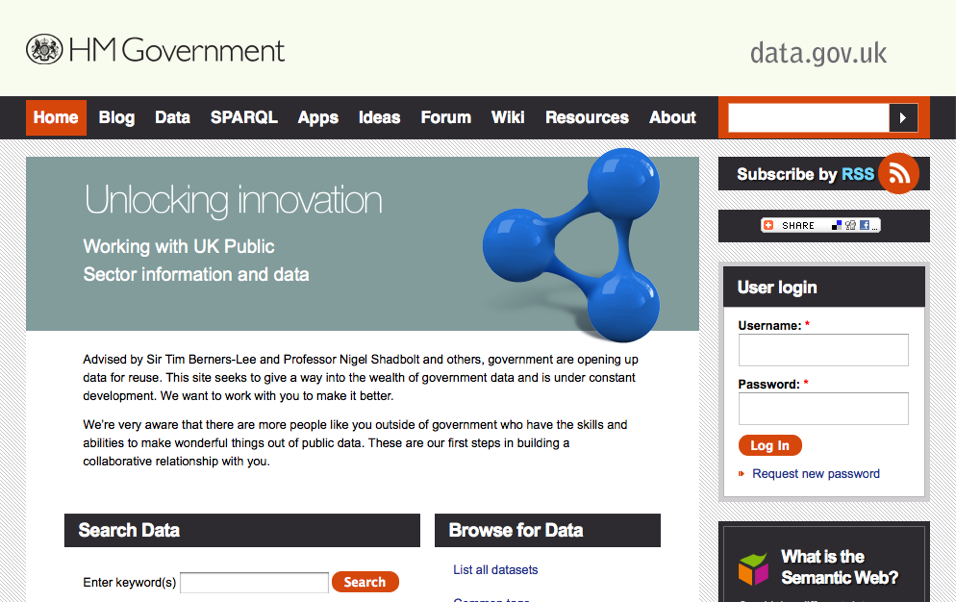

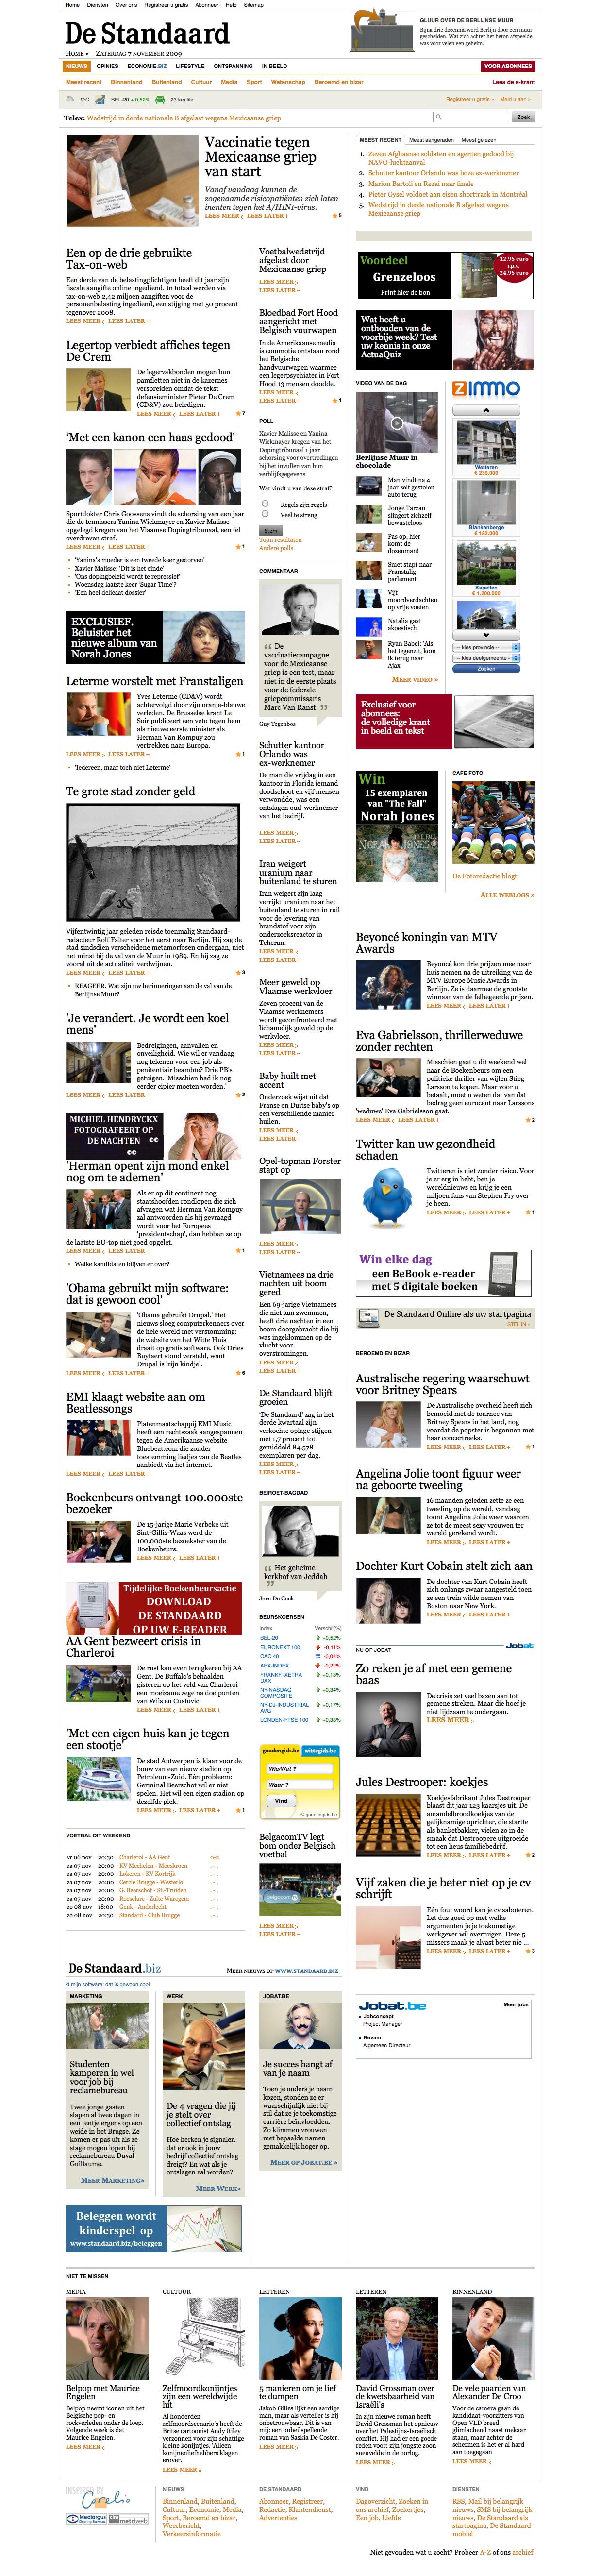
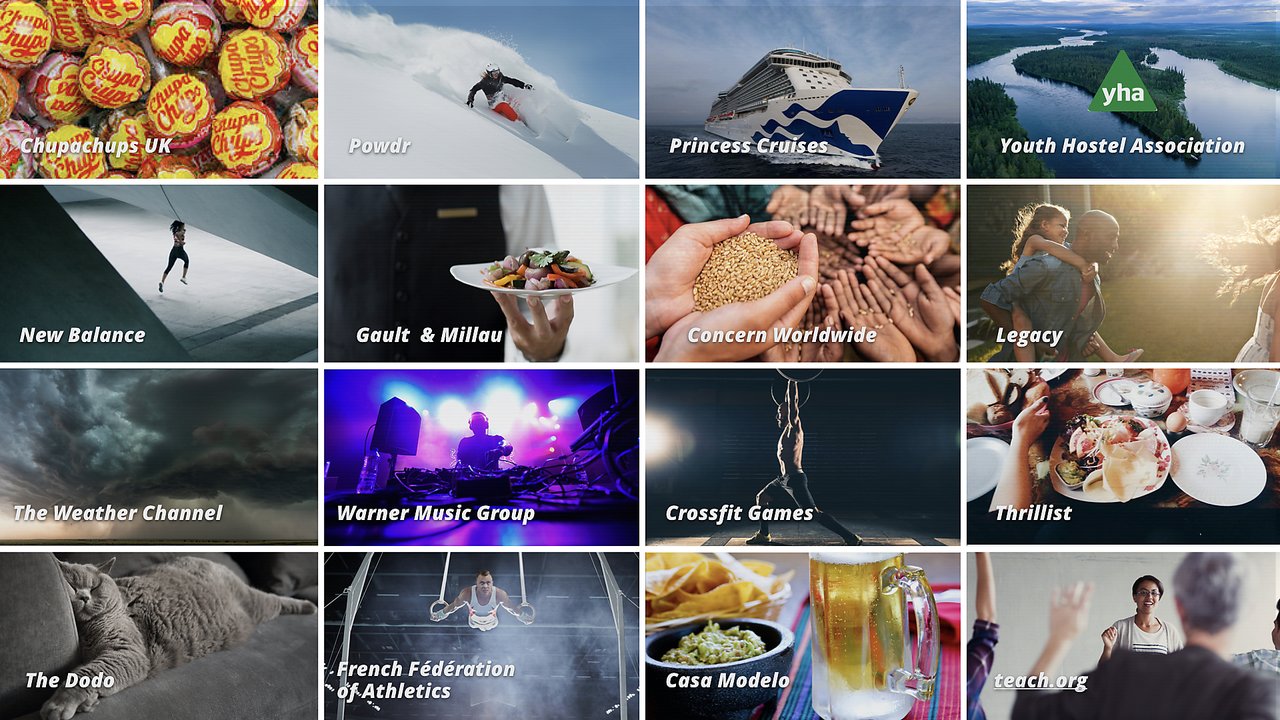 A few examples of organizations that use decoupled Drupal.

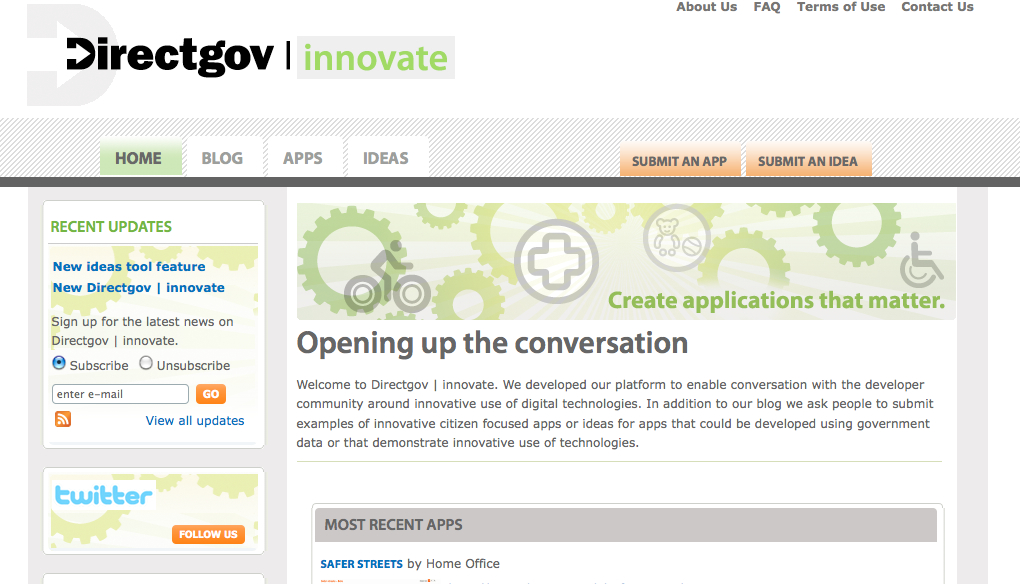
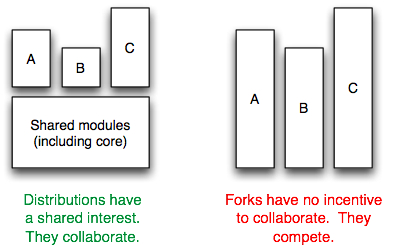


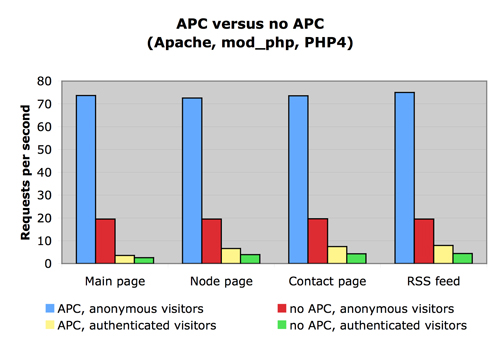
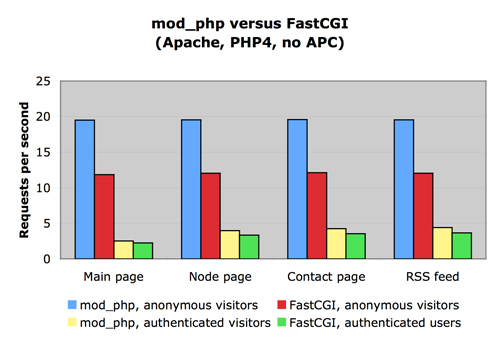
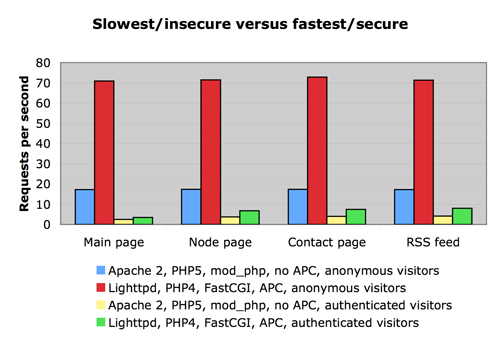
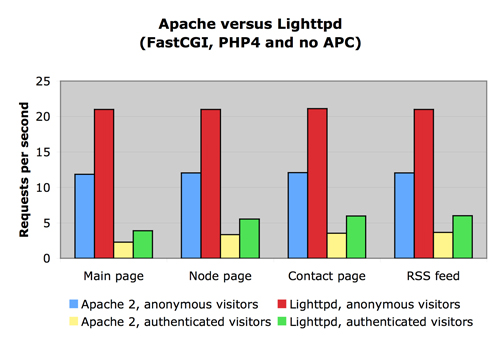
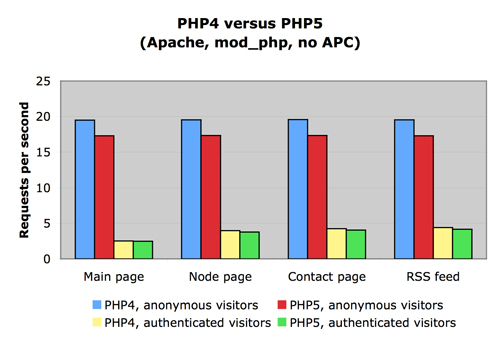
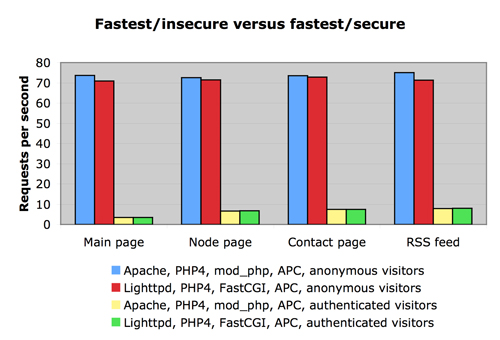
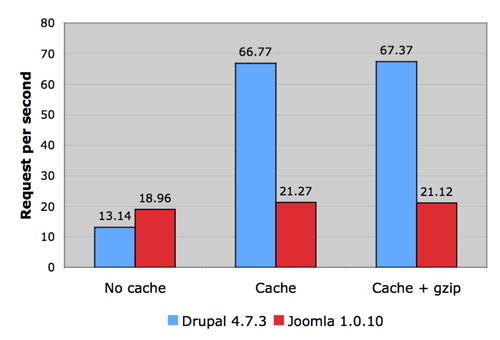
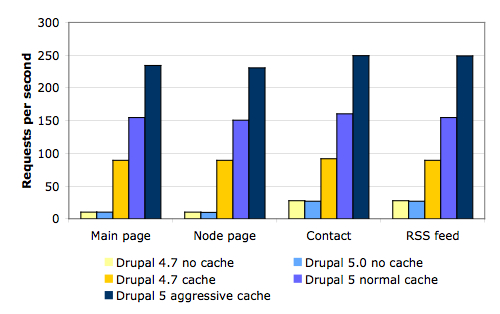 The number of pages Drupal can serve per second. Higher bars are better.
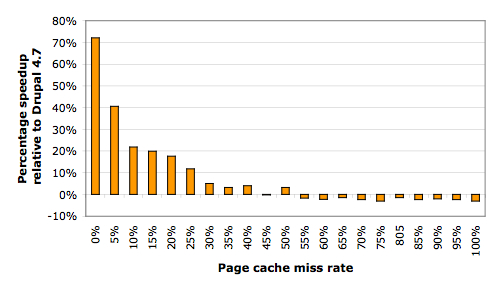 The relative performance improvement of Drupal 5's normal database caching compared to Drupal 4.7's database caching. A miss rate of 0% means that all page requests result in a cache hit and that all pages can be served from the database cache. A miss rate of 100% means that all page requests result in a cache miss, and that we had to dynamically generate all pages.
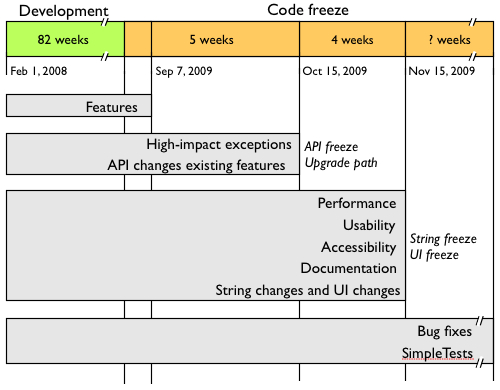
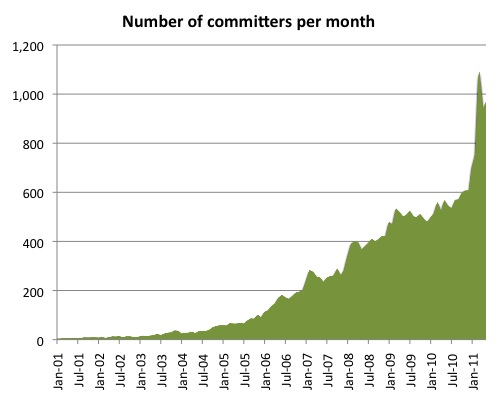
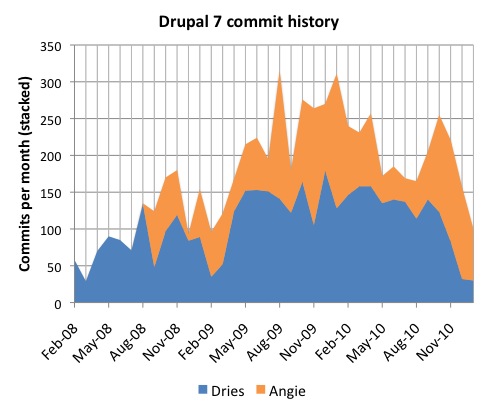 We opened the Drupal 7 development branch in February 2008, and released Drupal 7.0 in January 2011. This graph shows the stacked commit history from beginning to end. I appointed Angie as my Drupal 7 co-maintainer in August 2008 after having been the sole committer for 7 months. The peak around August 2009 (the highest peak) was the first attempted Drupal 7 code freeze. The momentum steadily built up towards the initial code freeze date. Interestingly, we remained most productive during the extended code freeze period ... more code freezes are better than one code freeze? ;-)
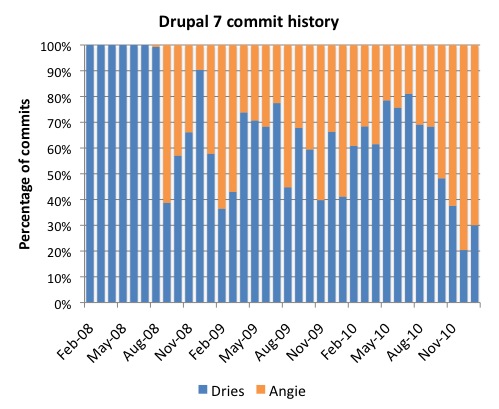 I averaged at 3.6 commits per day, whereas Angie's average is 2.6 commits per day (including weekends and holidays).
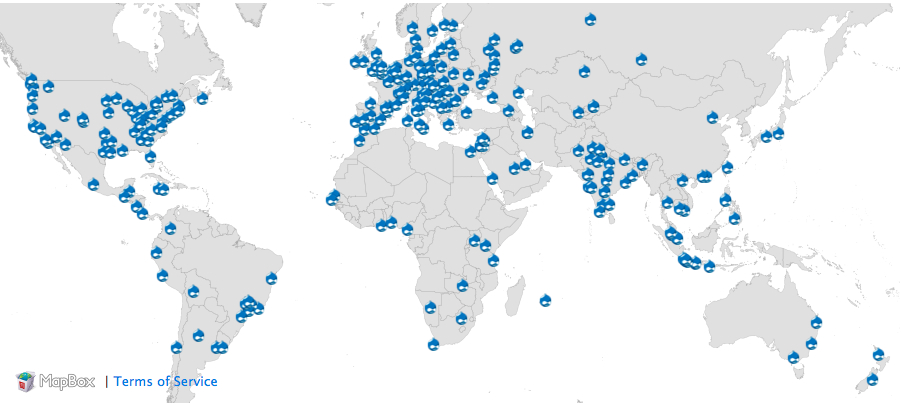 A map of all the Drupal 7 release parties around the world: over 250 parties in more than 90 countries.
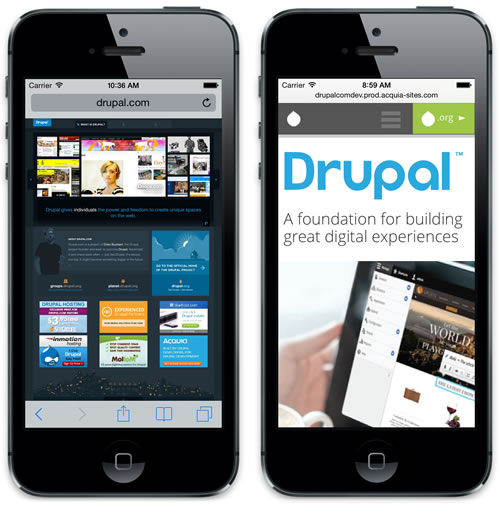
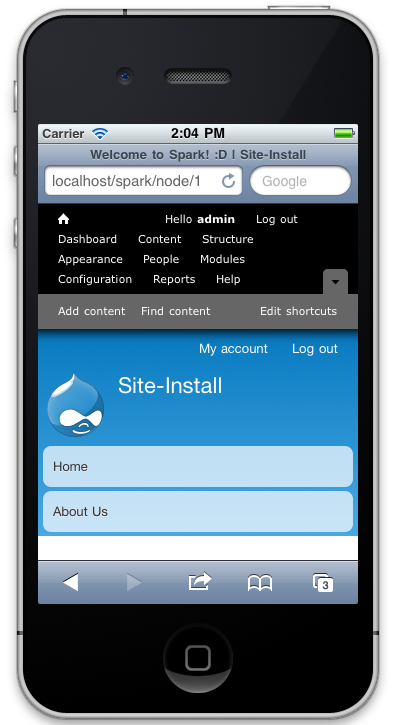 On an iPhone or other mobile device, the default Drupal 7 toolbar and shortcut bars both wrap, taking up nearly a third of the screen.
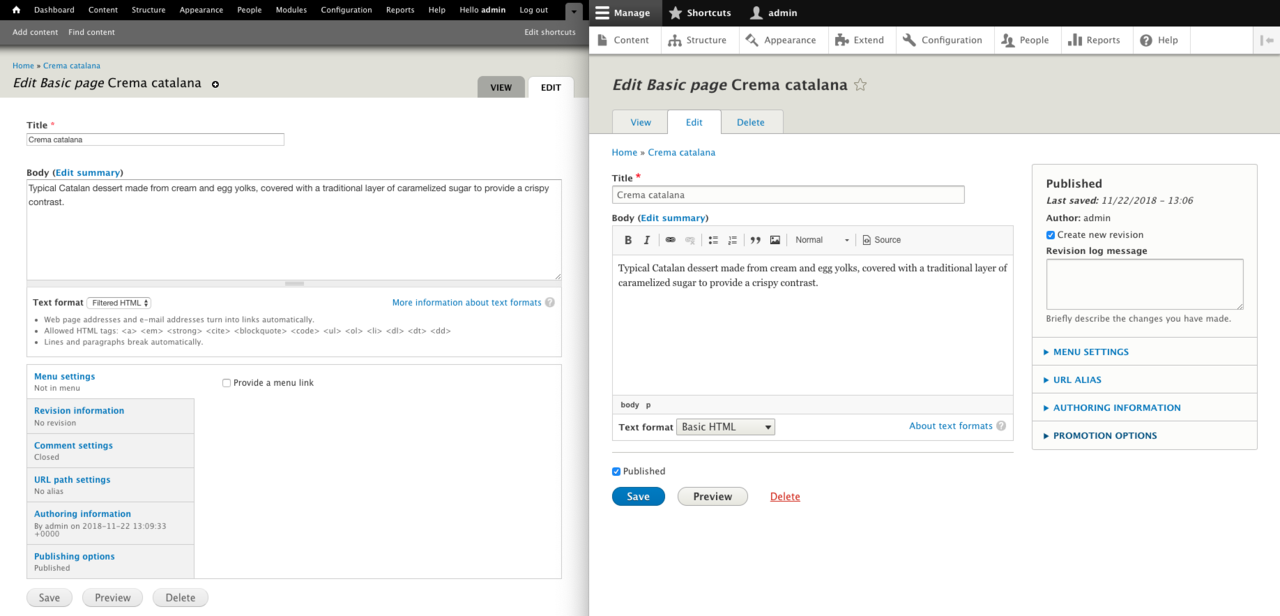 A comparison of the Drupal 7 and Drupal 8 content creation screen to highlight some of the improvements in Drupal 8.
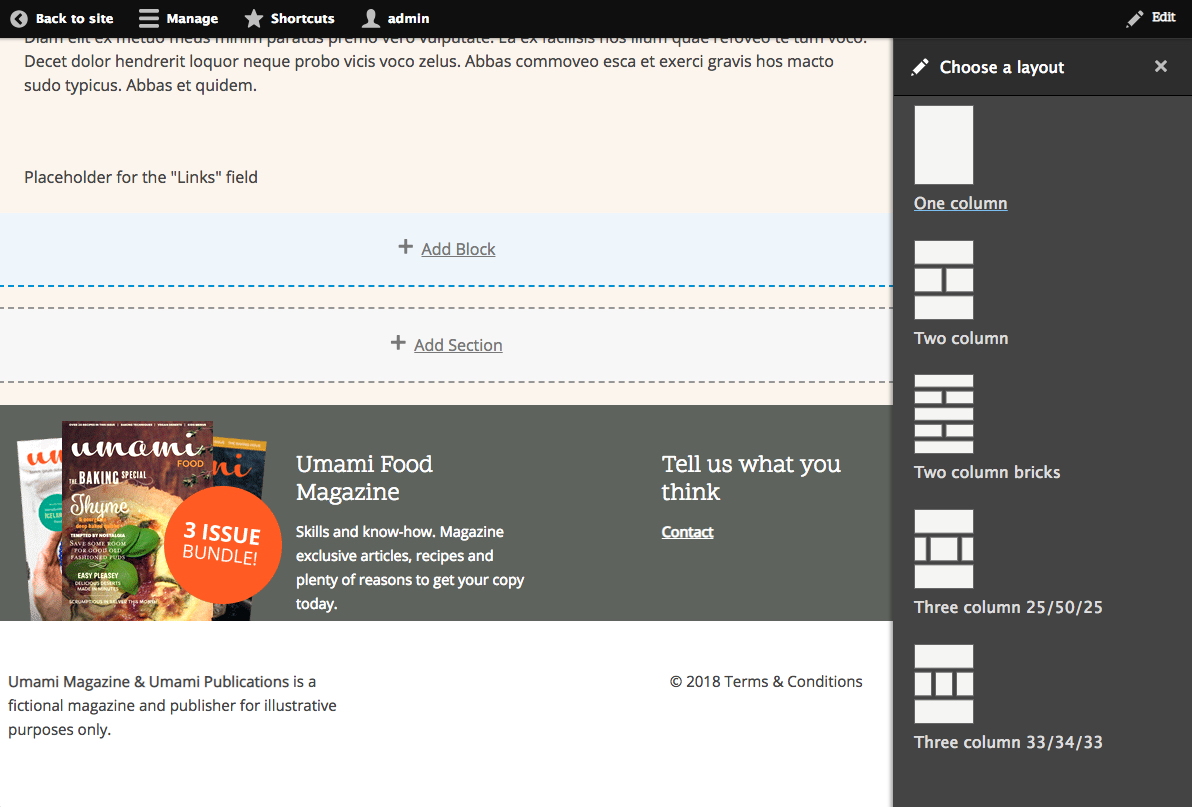 The new Umami demo profile together with the Layout Builder.
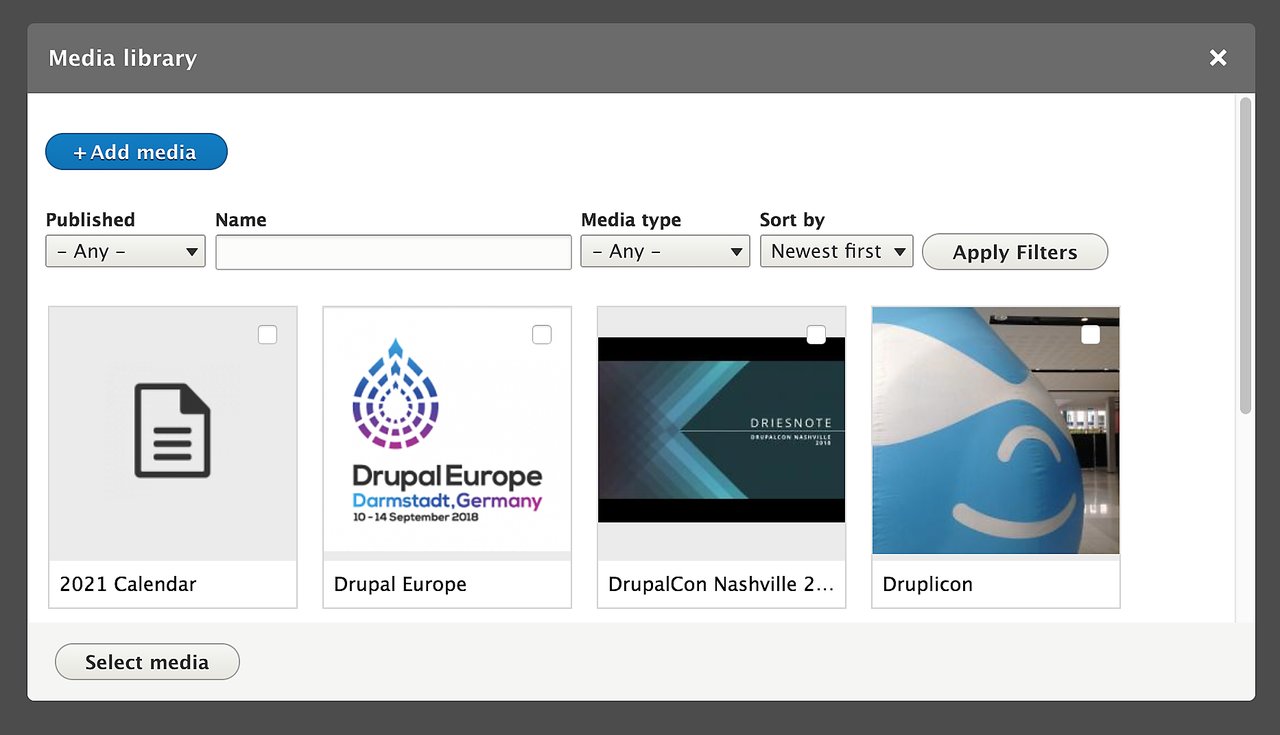 The Media Library in Drupal 8.6
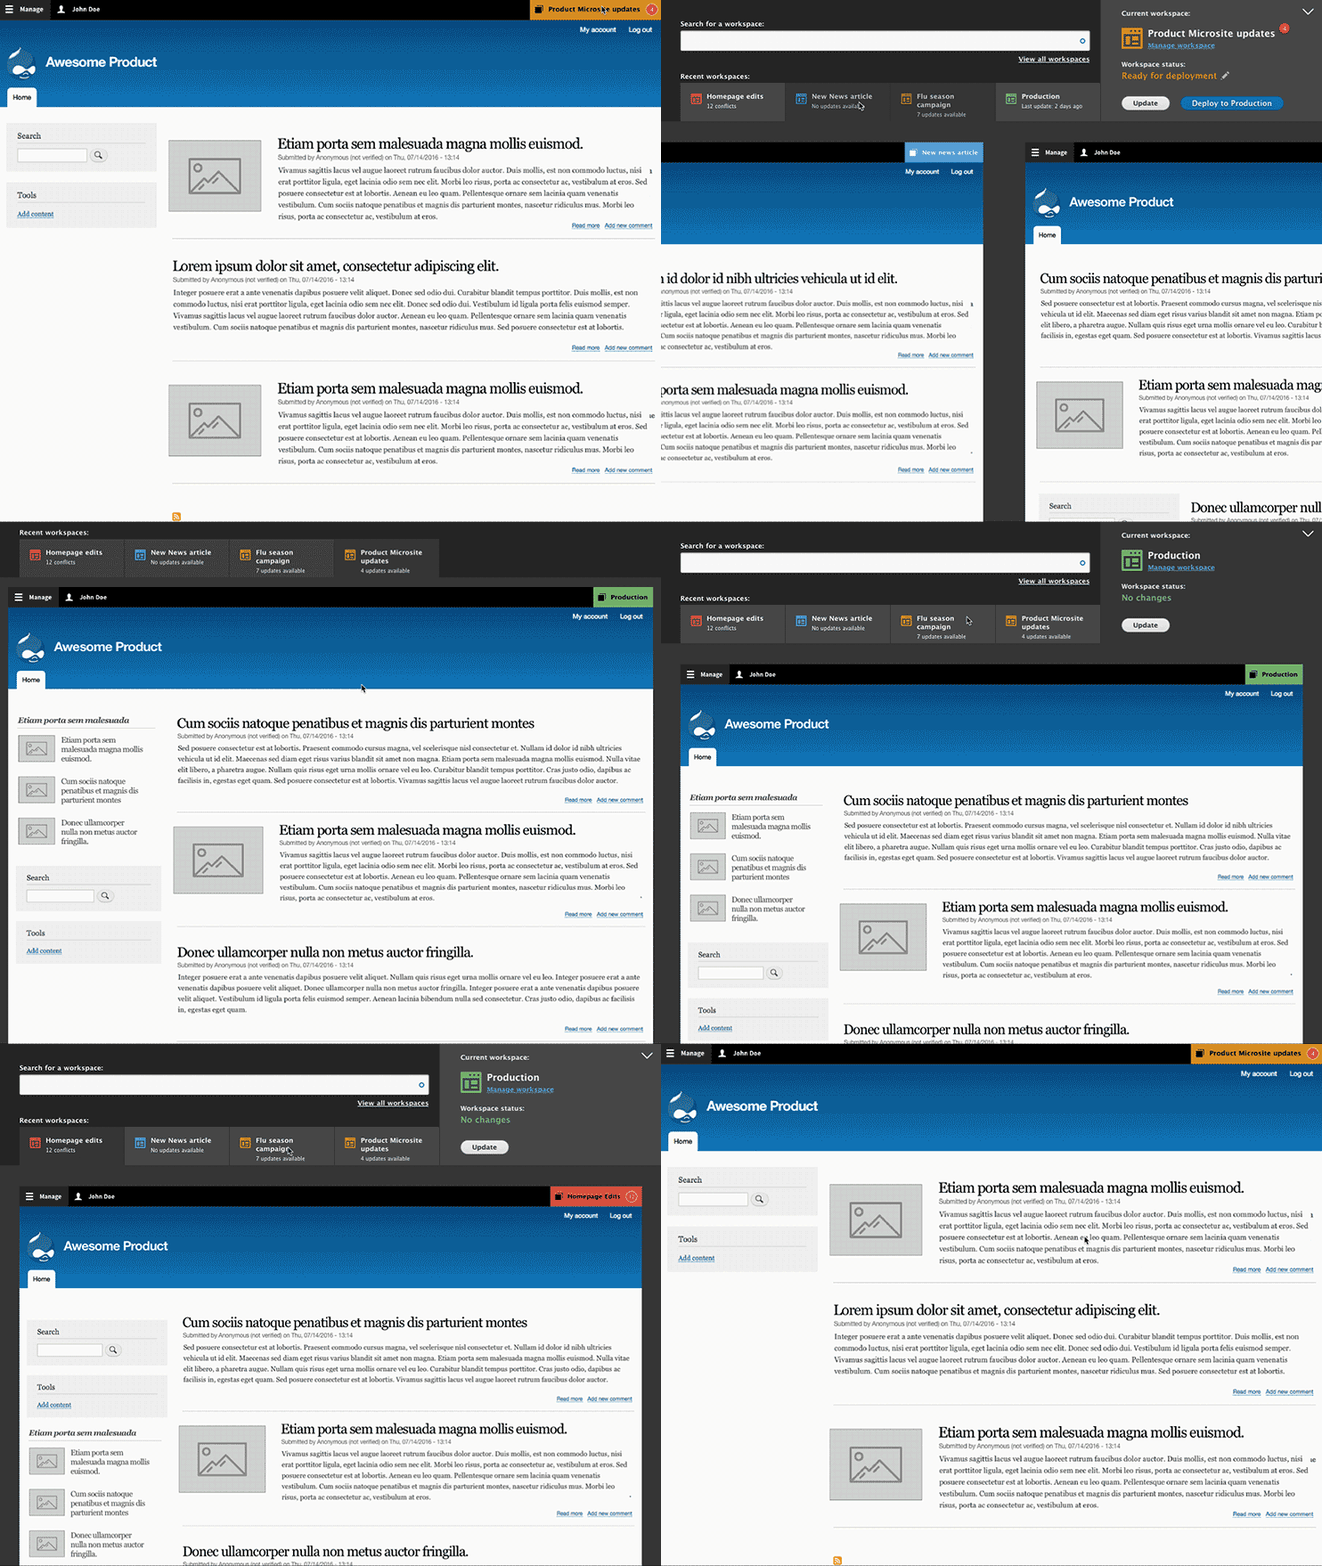
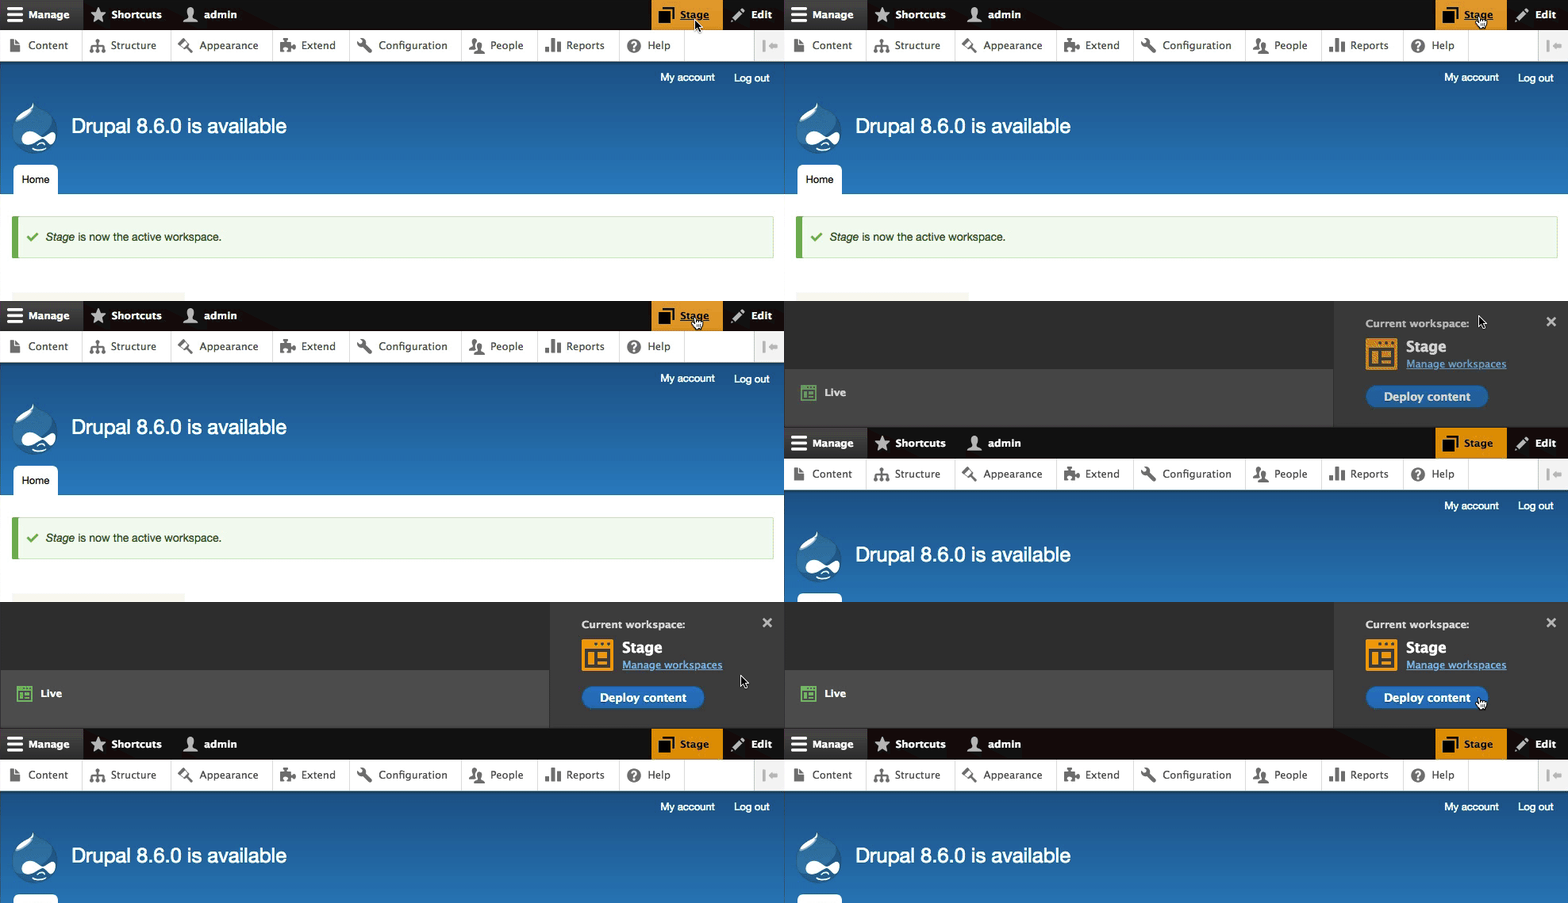 The Workspaces module in Drupal 8.6




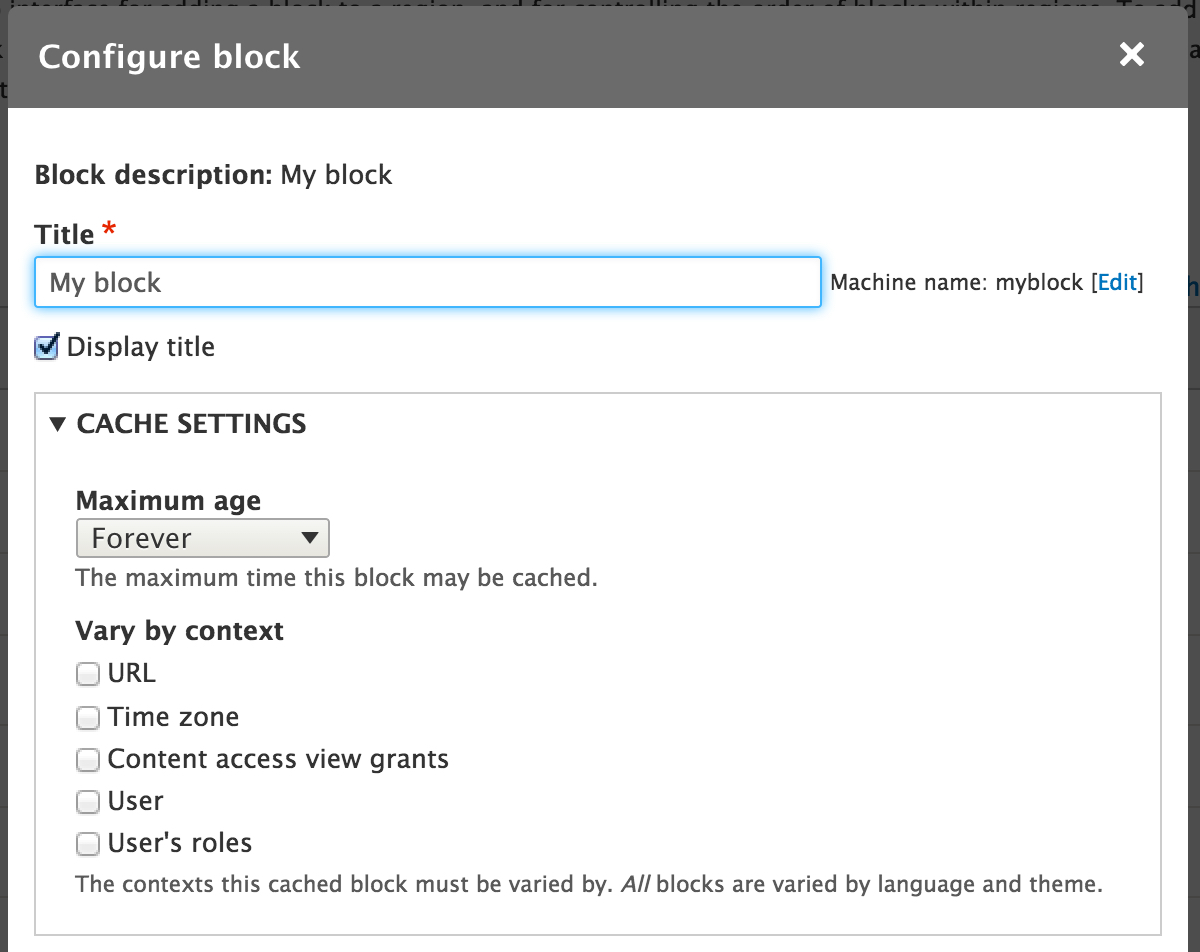
 Example cache tags for different cache IDs.
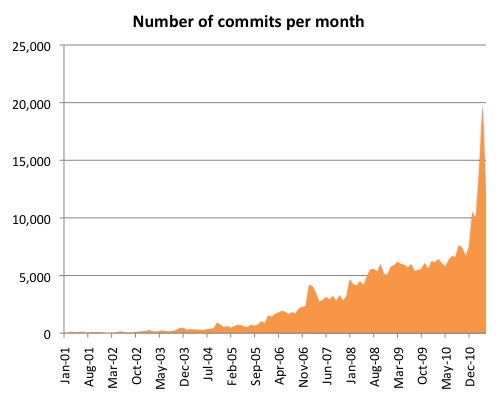
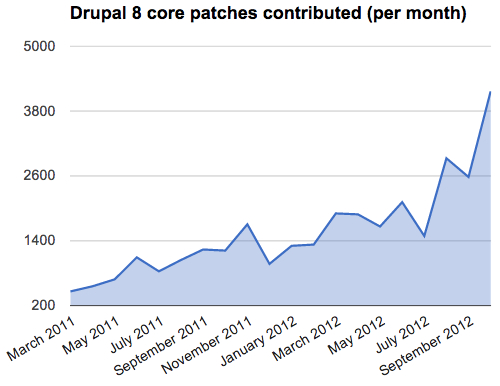 Momentum around Drupal core has increased from around 400 patch contributions per month in March of 2011 to over 4,000 in October of 2012.

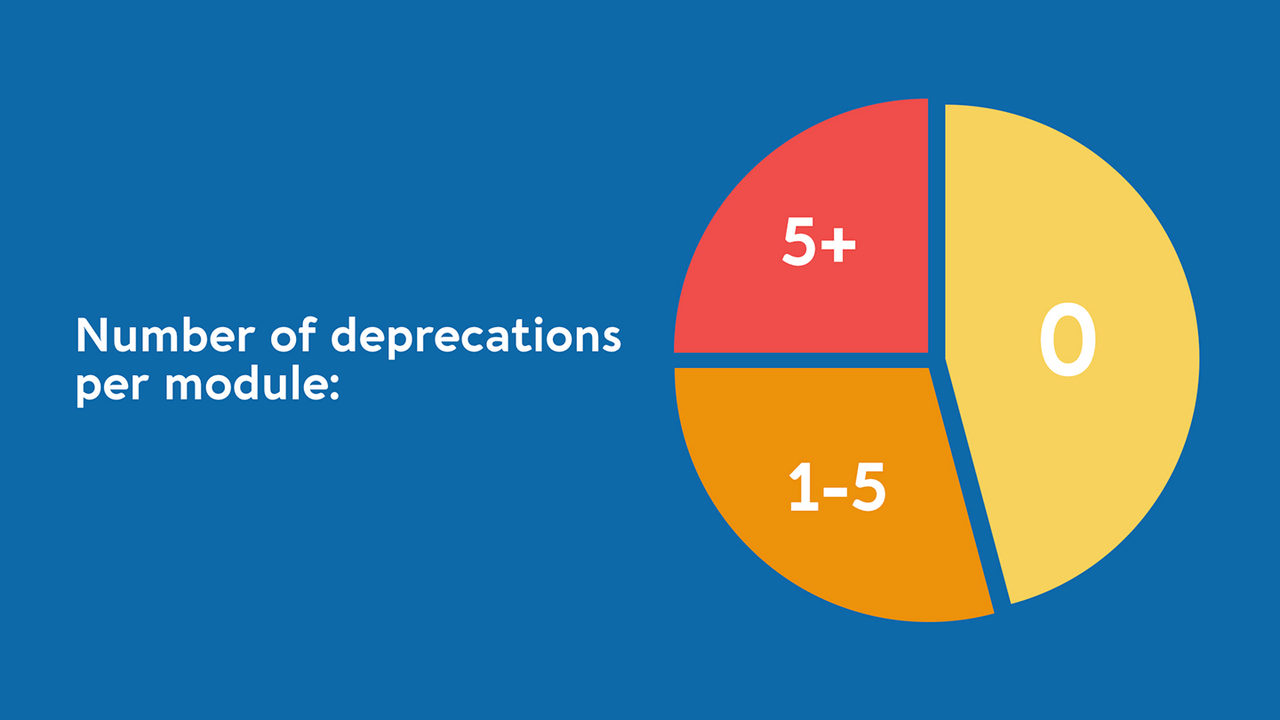 Most contributed modules currently have no or very few deprecation warnings today. Only a fourth of the modules have 5 or more deprecations.



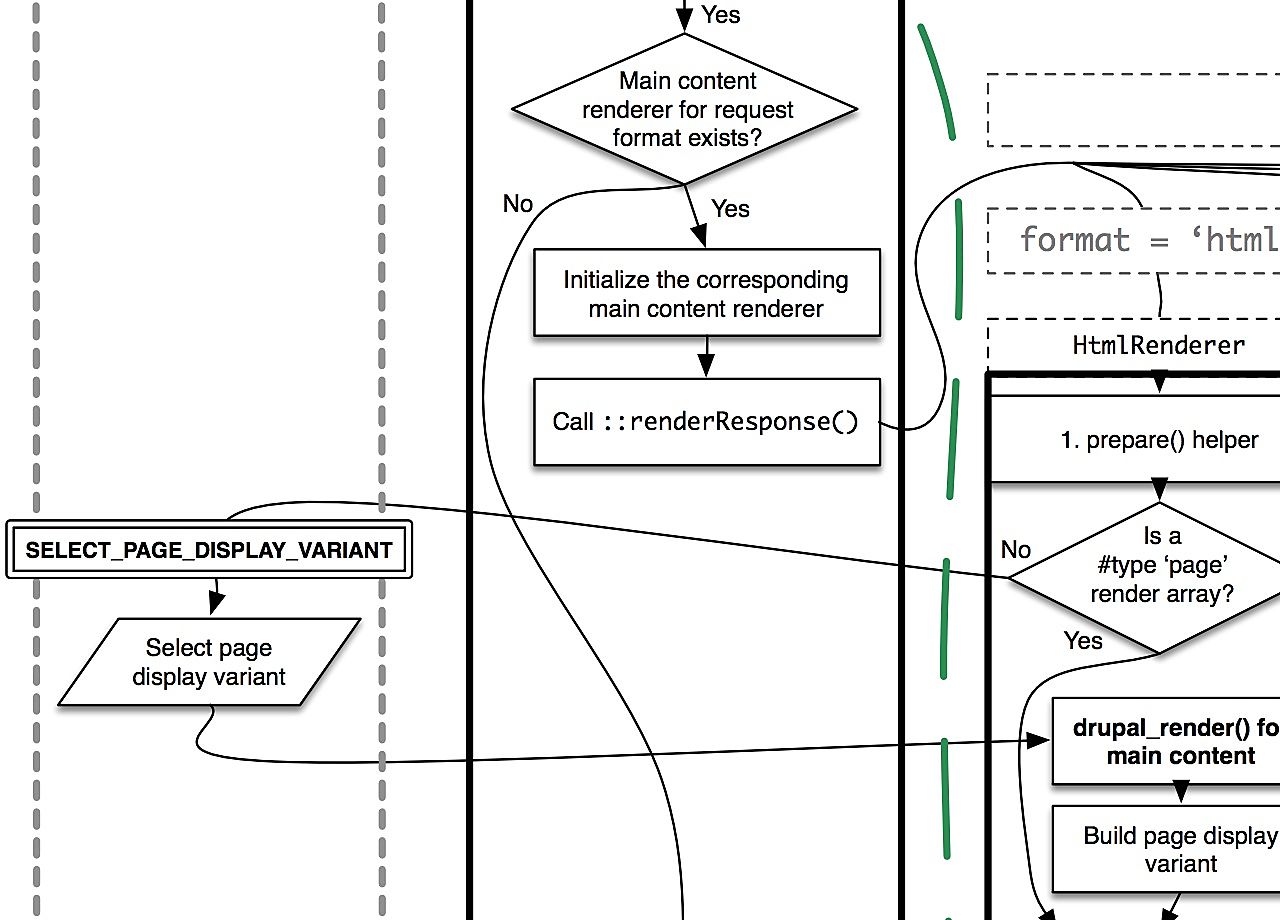 A snapshot of the Drupal 8 render pipeline diagram that highlights where alternative render strategies can be implemented.
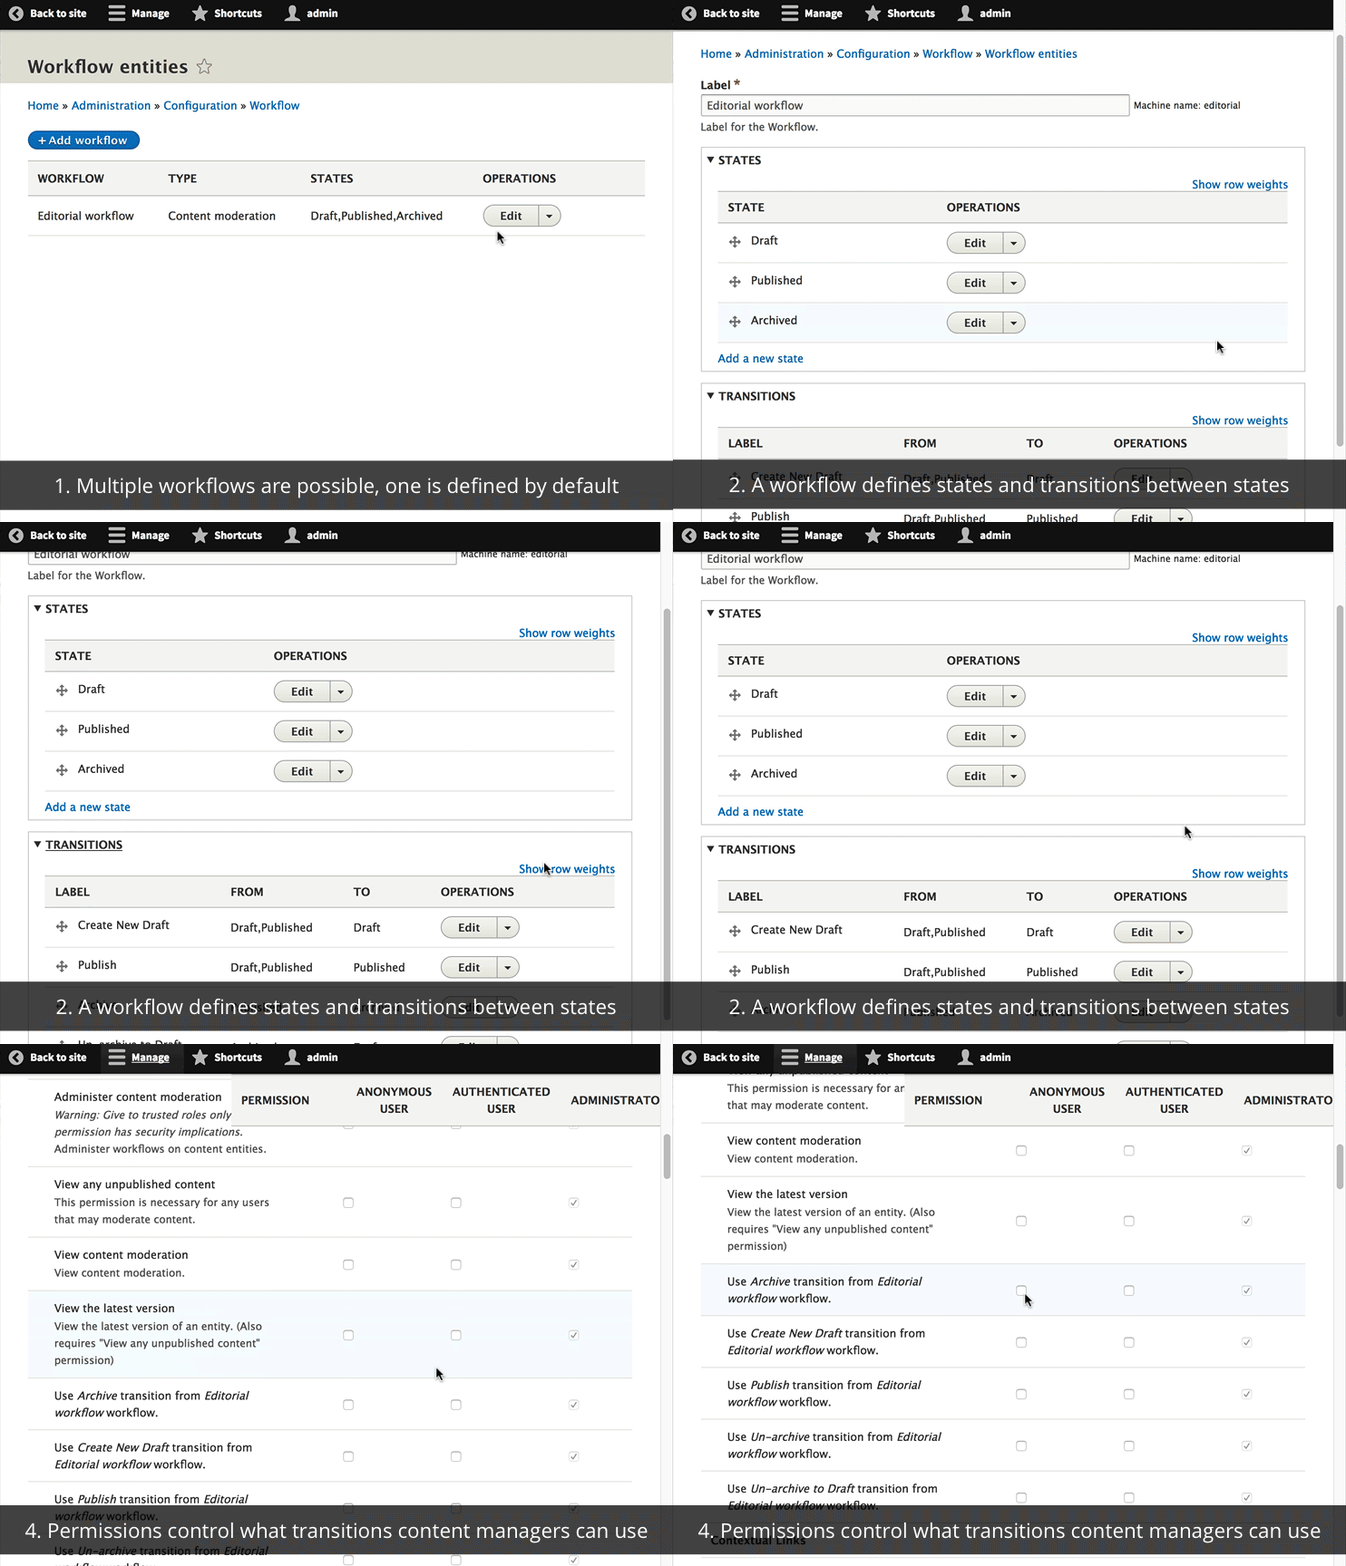 Drupal 8.3 will support multiple different editorial workflows. Each workflow can define its own workflow states as well as the possible transitions between them. Each transition has permissions associated with them to control who can move content from one state to another.
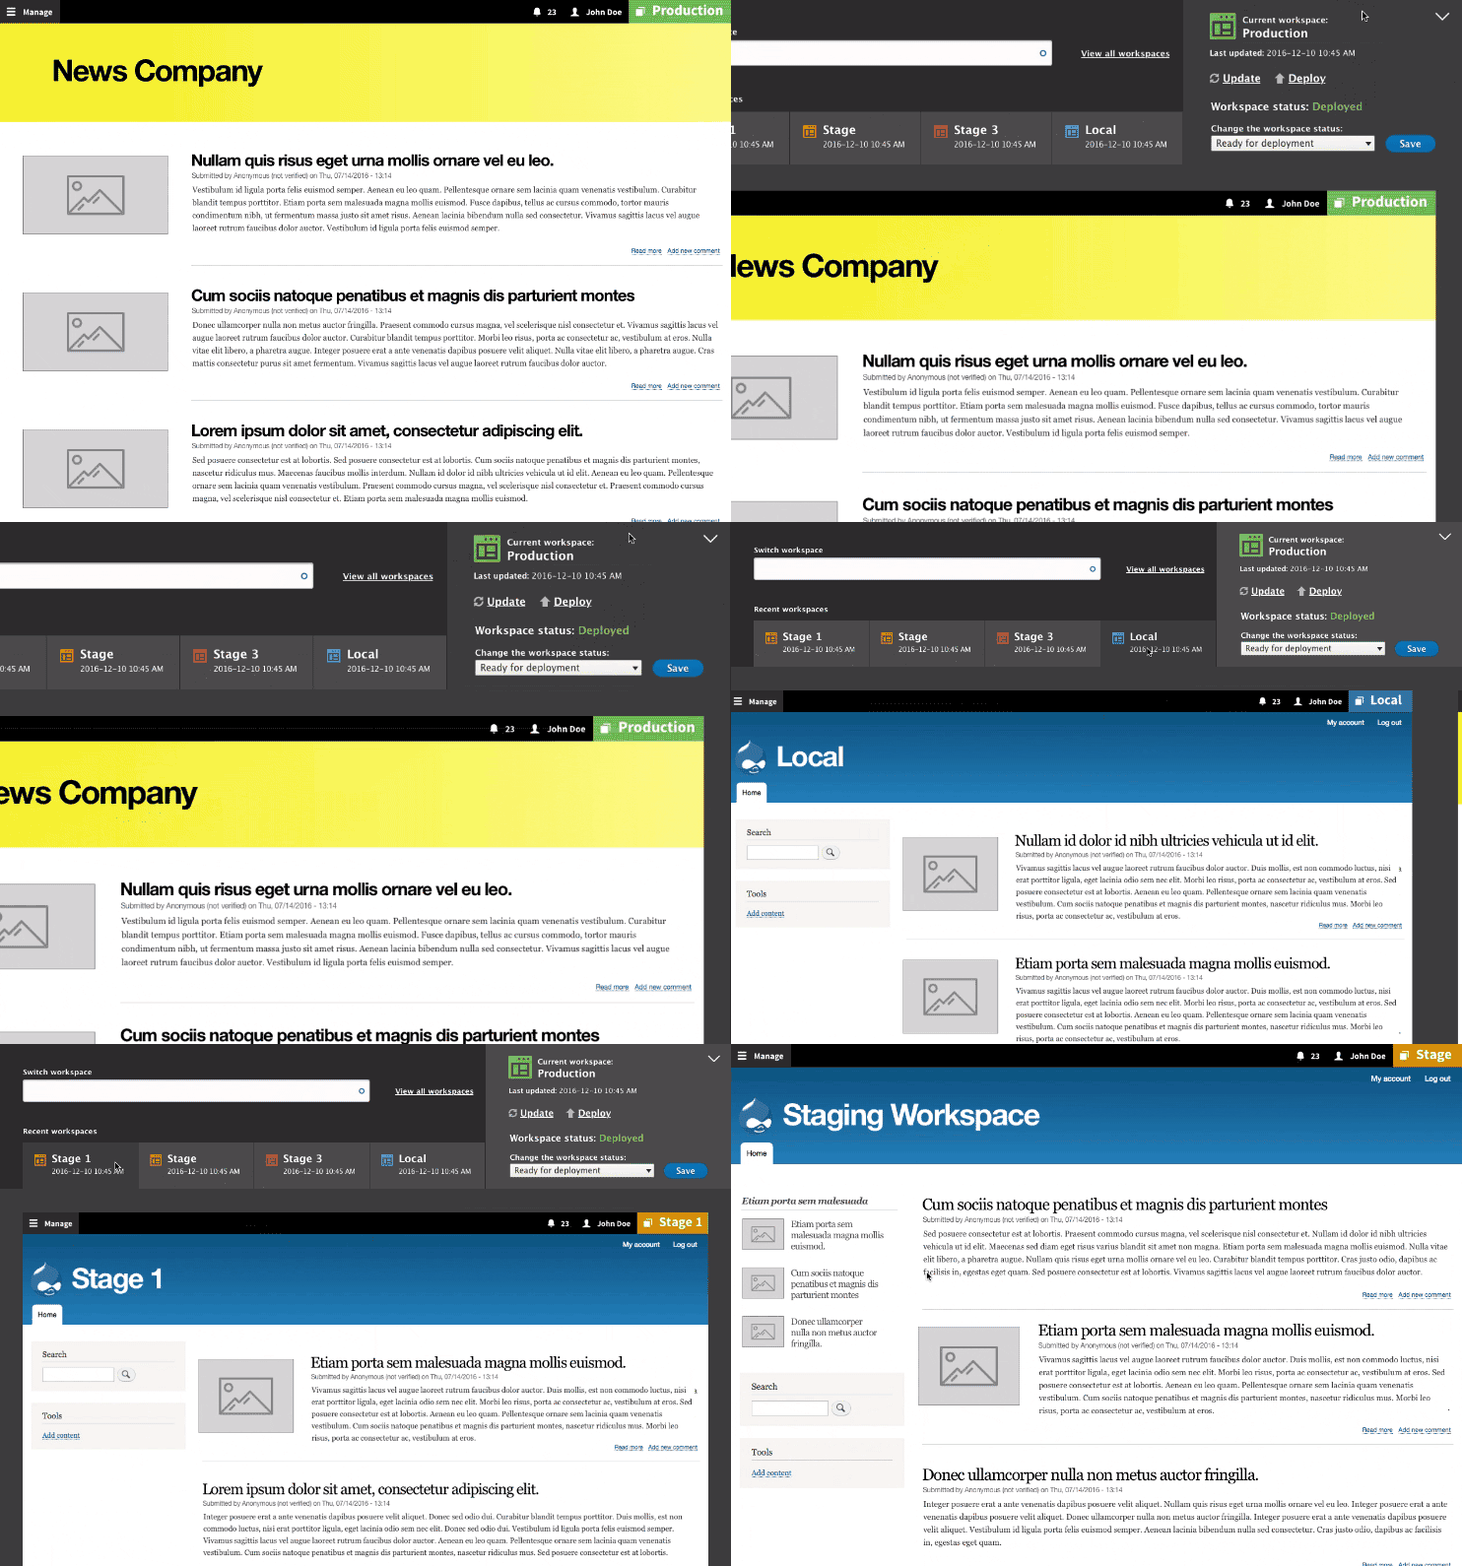 An outside-in design that shows how content creators could work in different workspaces. When you're building out a new section on your site, you want to preview your entire site, and publish all the changes at once. Designed by Jozef Toth at Pfizer.


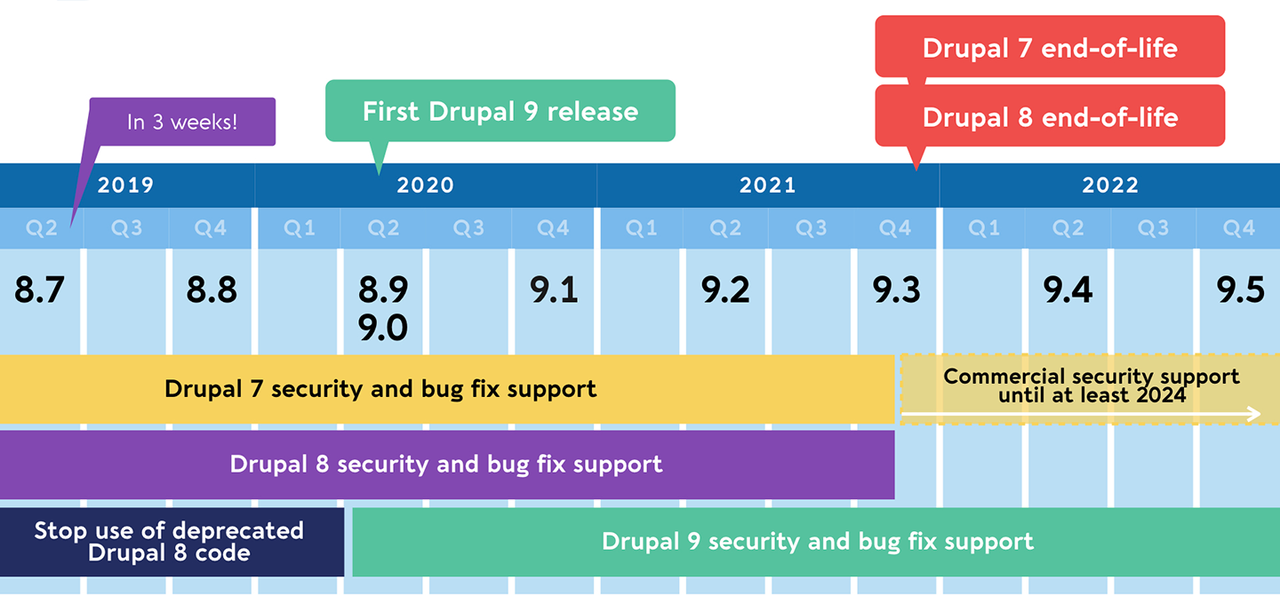
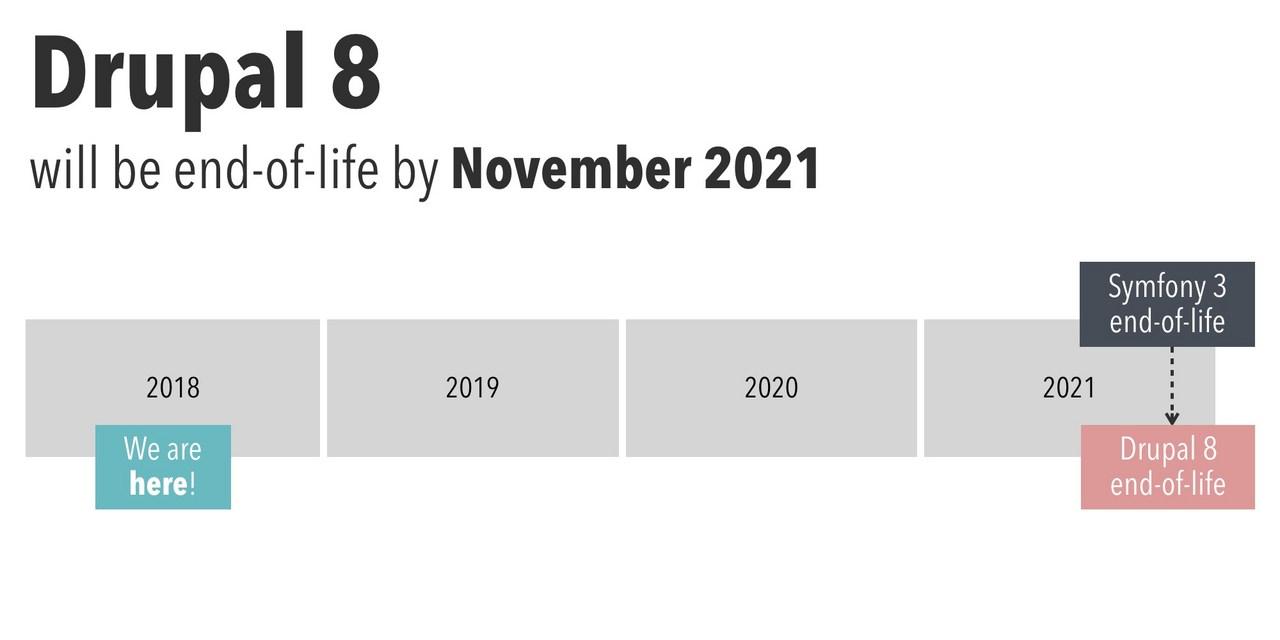
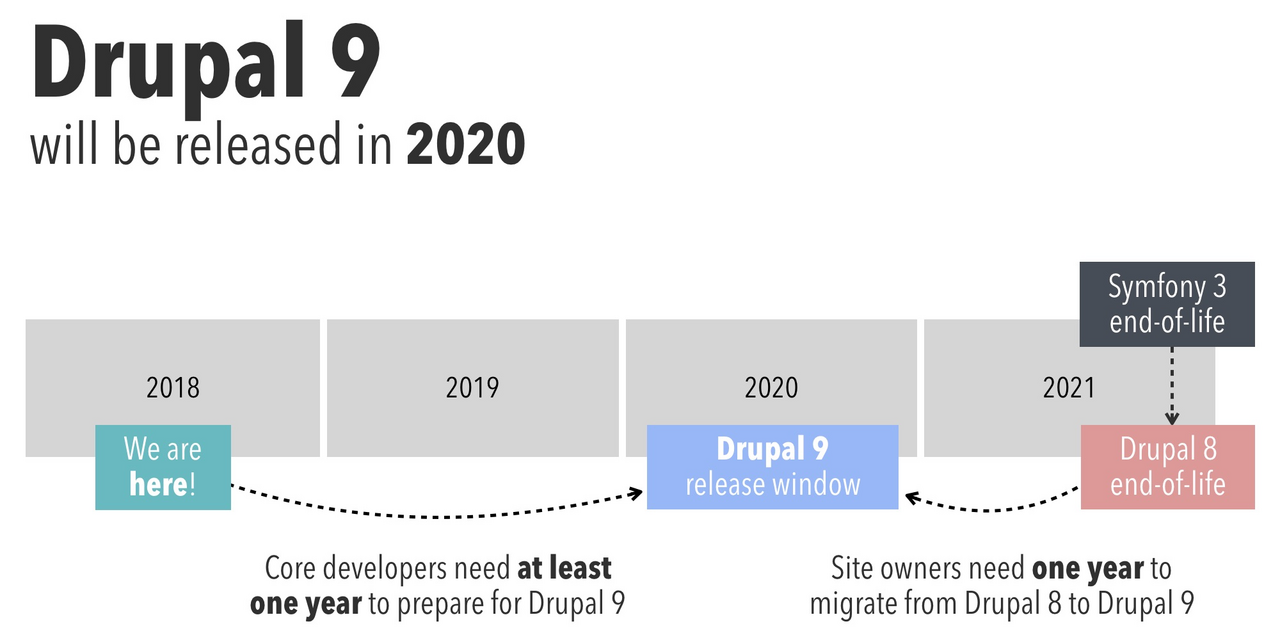
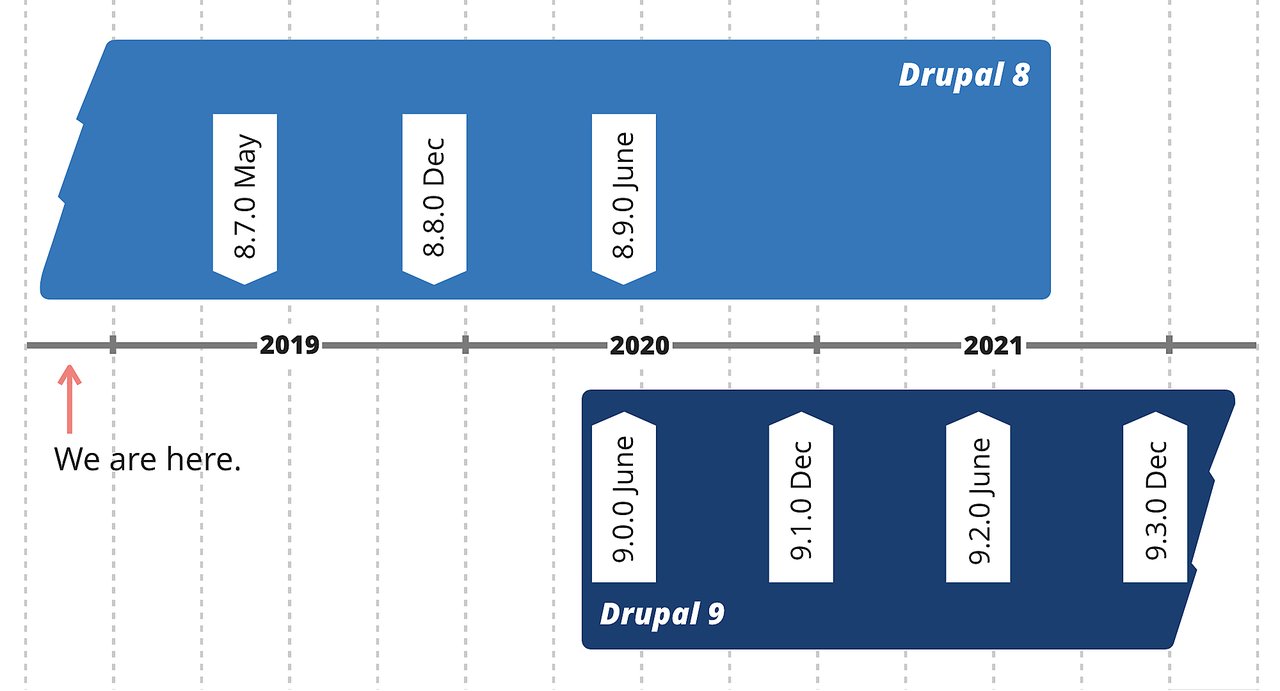 Planned Drupal 8 and 9 minor release dates.
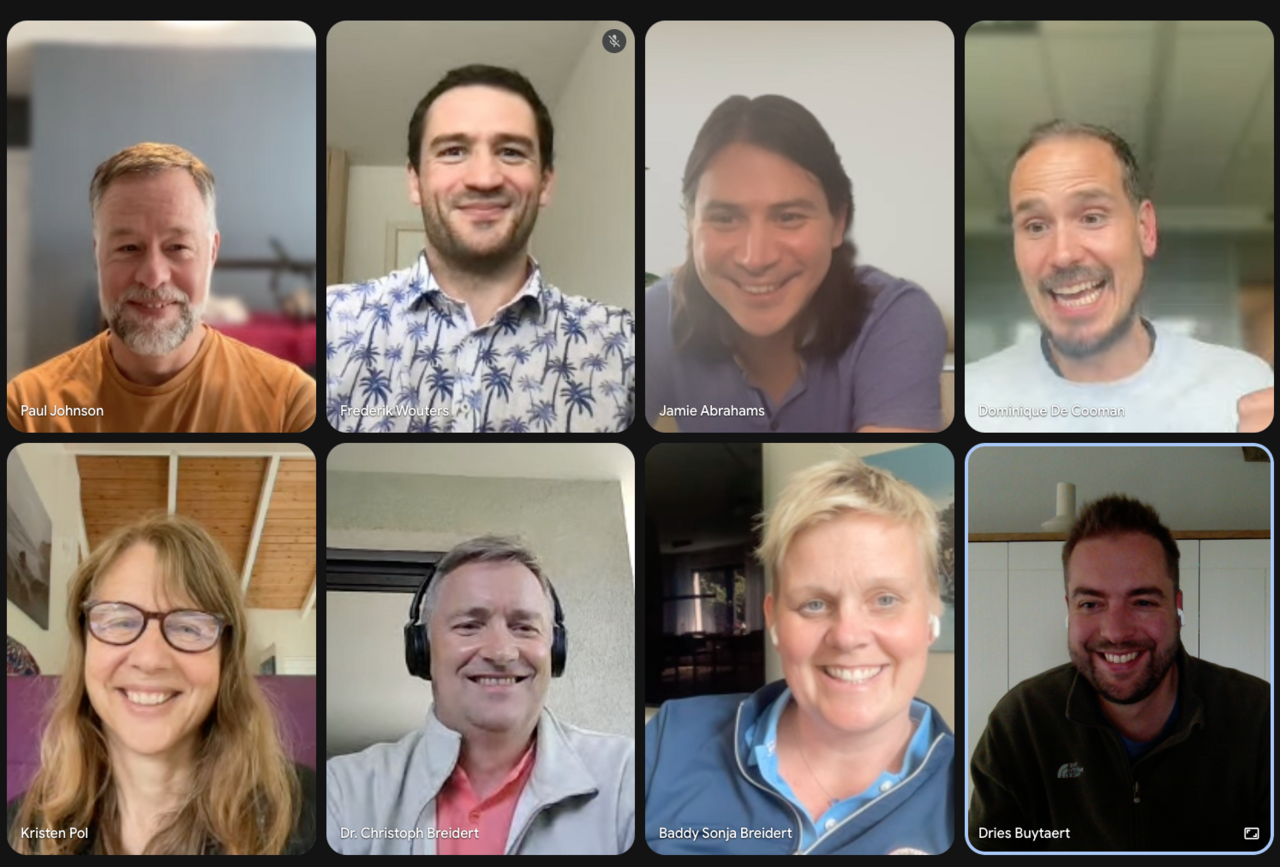 Some of the founding members of the Drupal AI initiative during our launch call on Google Hangouts.

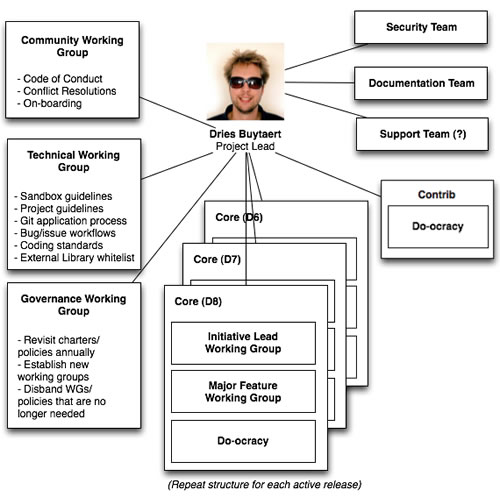
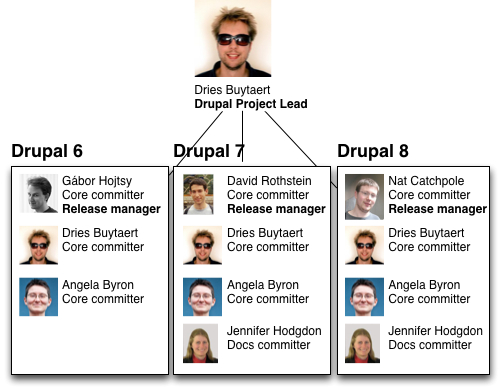
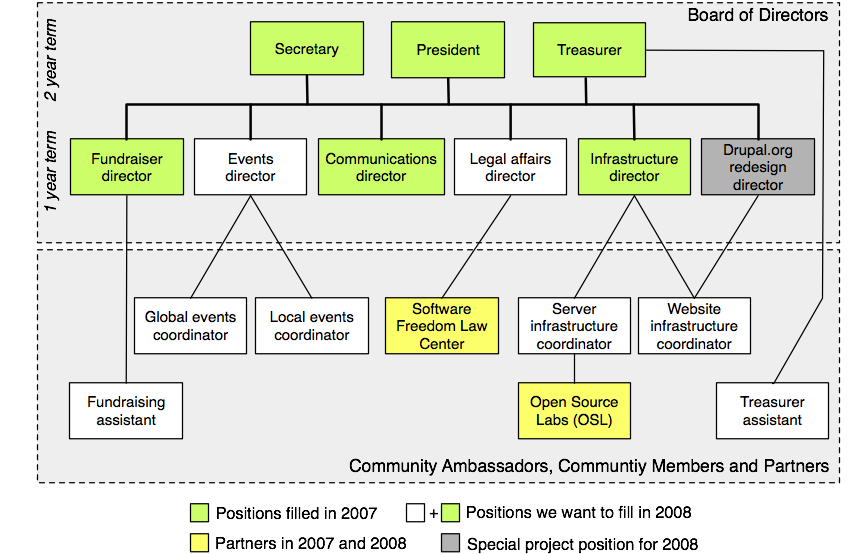
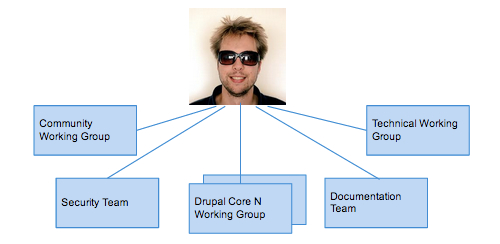
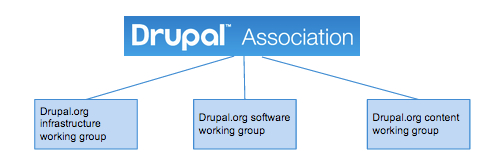
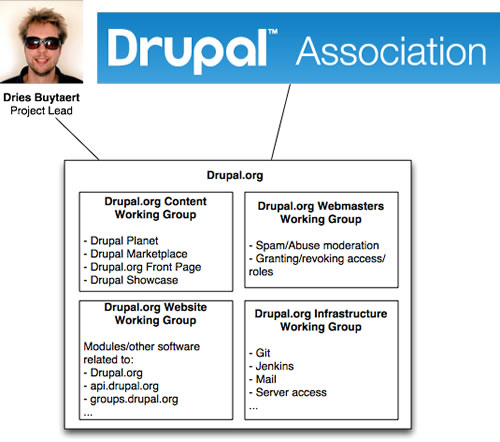
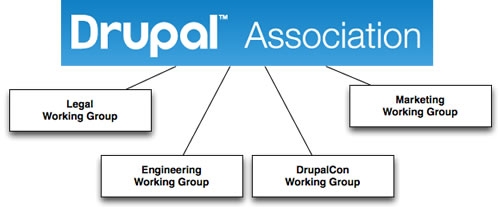
 See also: larger version of the organizational chart.
 Drupal-blue LEDs, controllable through a REST API and a Drupal website. © Phil Norton.
 © Rob Cottingham.
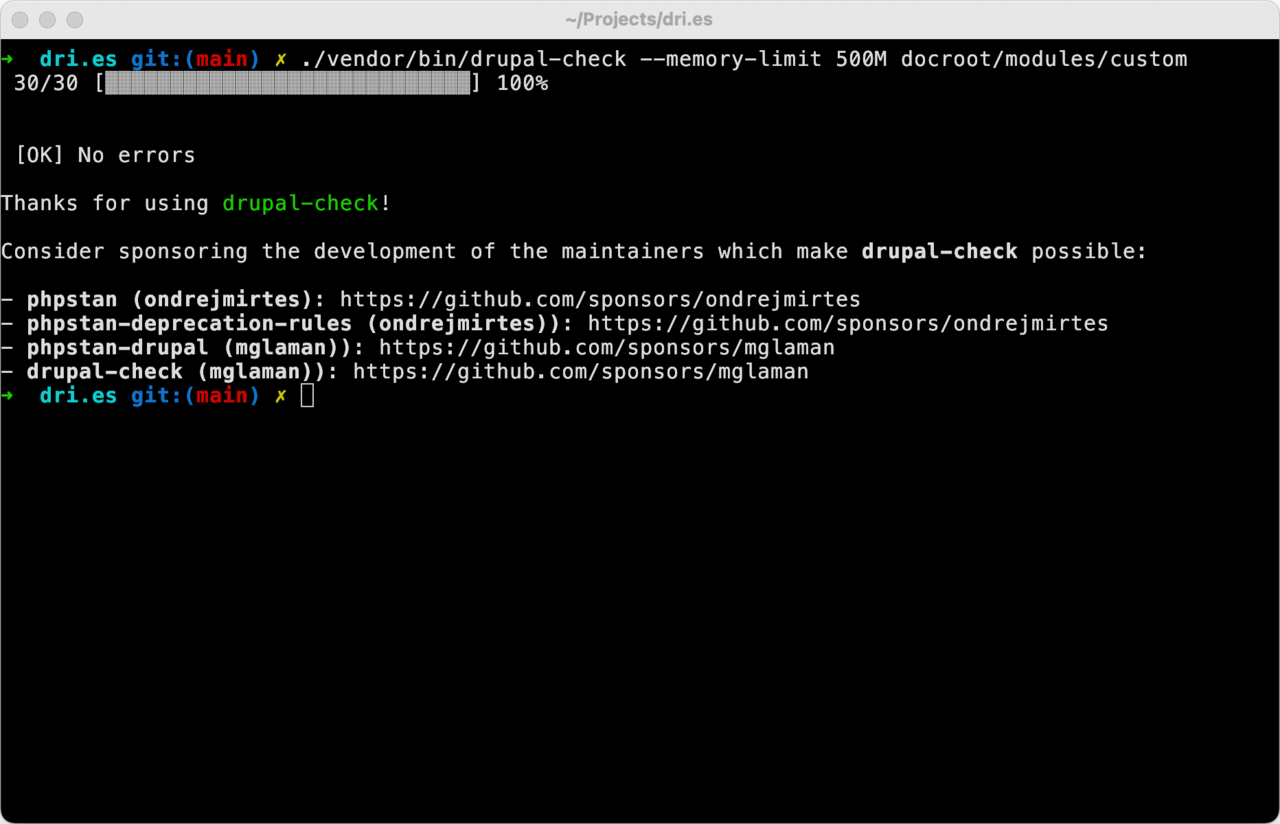 Output of Drupal Check command indicating no deprecated code was found.

 Drupal.com as launched in 2005.
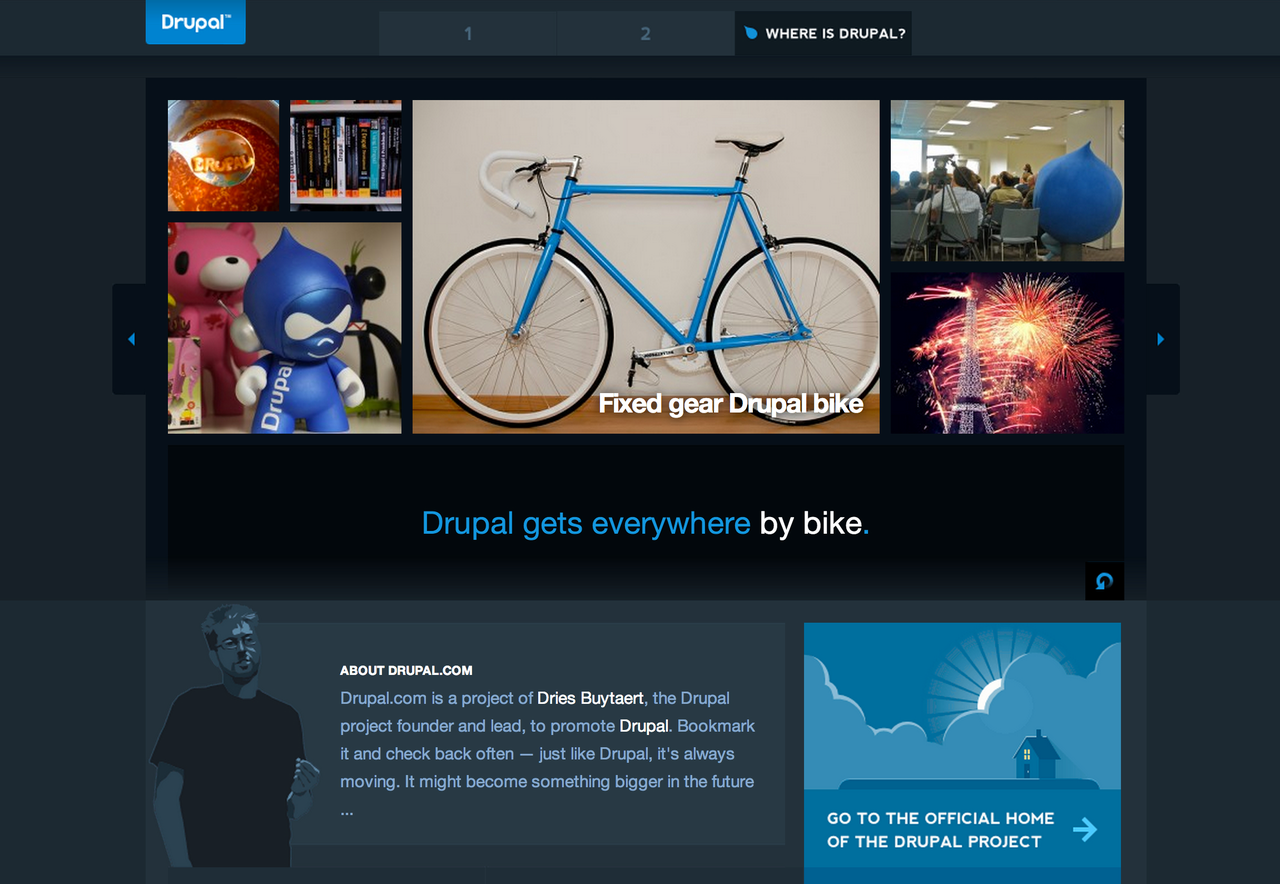 Drupal.com as launched in 2009.
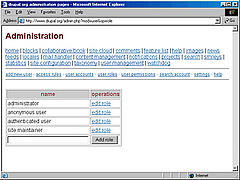 How Drupal looked like in 2003.
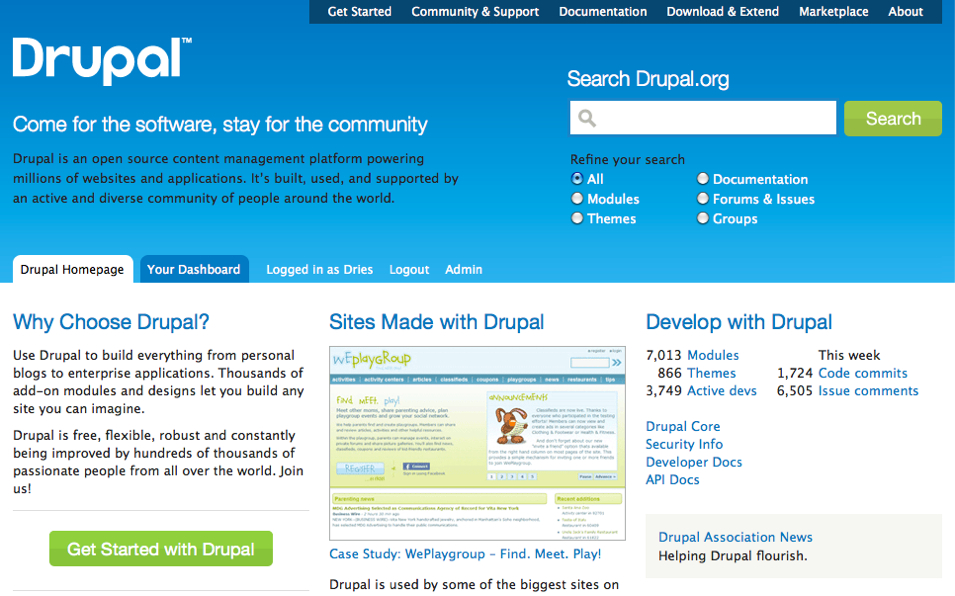
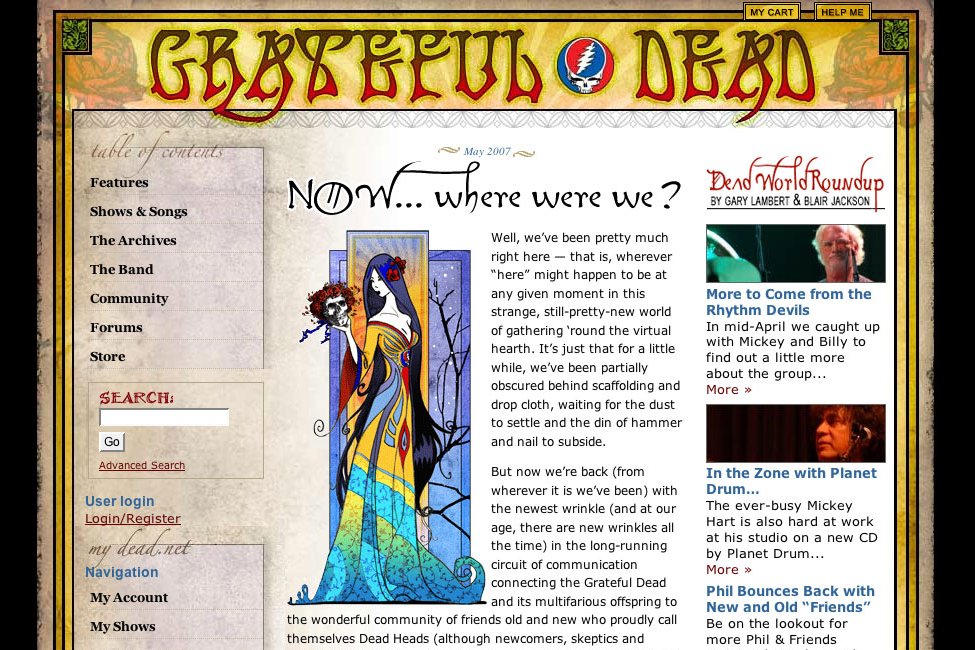
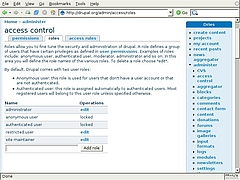 How Drupal looks in 2006.
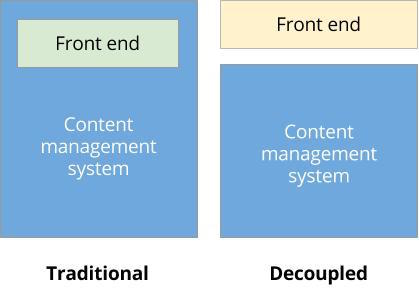
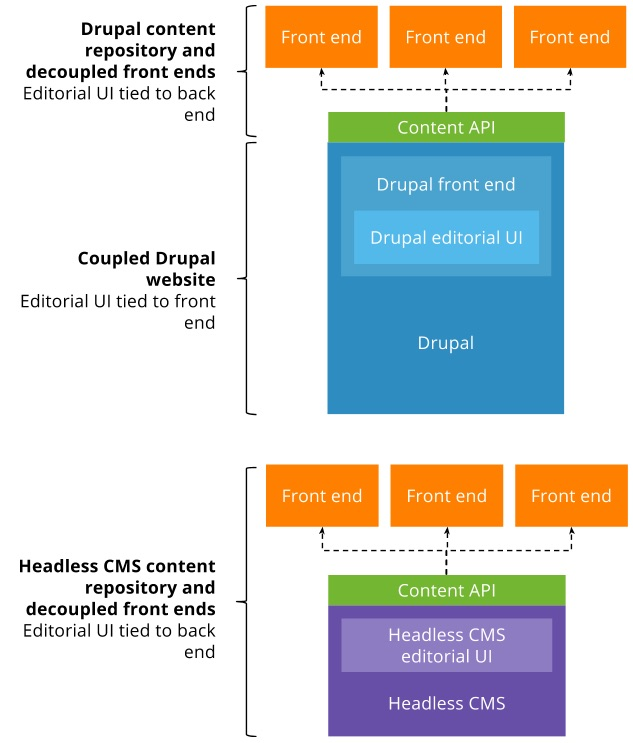 This diagram illustrates the differences between a coupled – but headless-enabled – Drupal website and a headless CMS with various front ends receiving content.
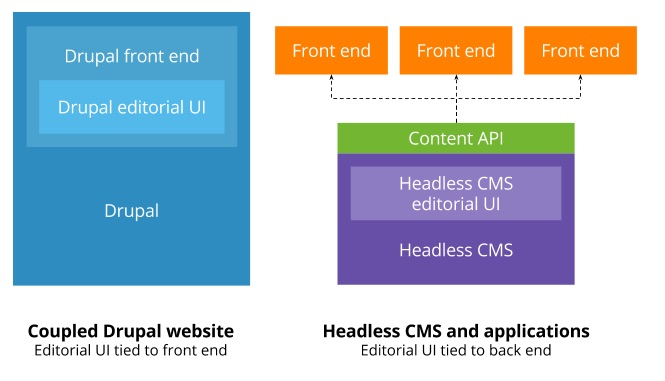 This diagram illustrates the differences between a traditional Drupal website and a headless CMS with various front ends receiving content.
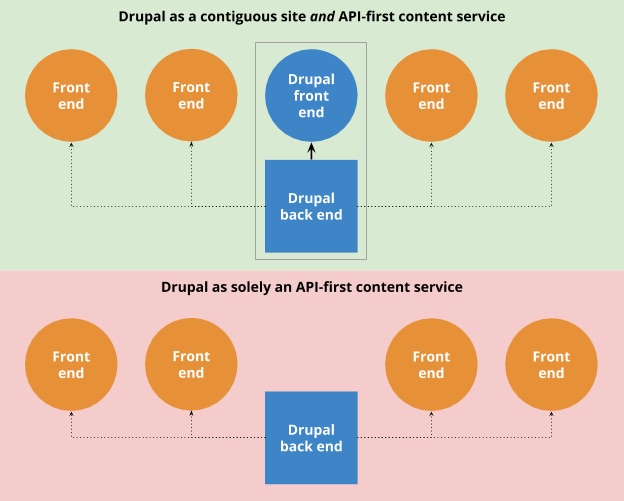 This diagram illustrates the ideal architecture for Drupal, which should be leveraged as both a front end in and of itself as well as a content service for other front ends.
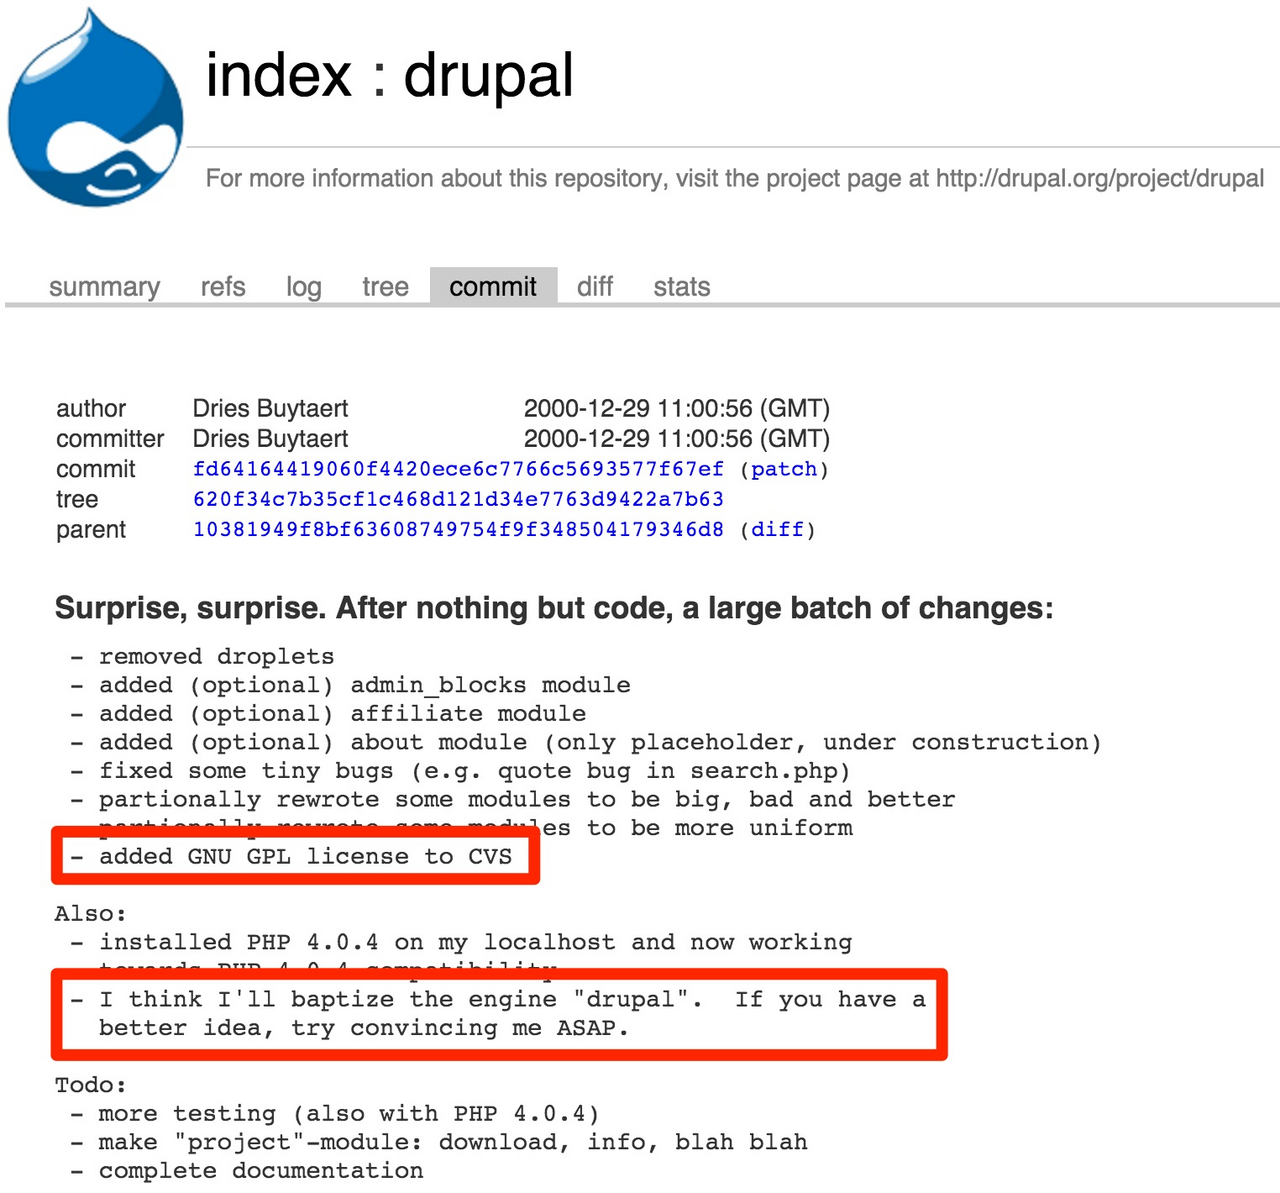 The commit where I dubbed my website project "Drupal" and added the GPL license.
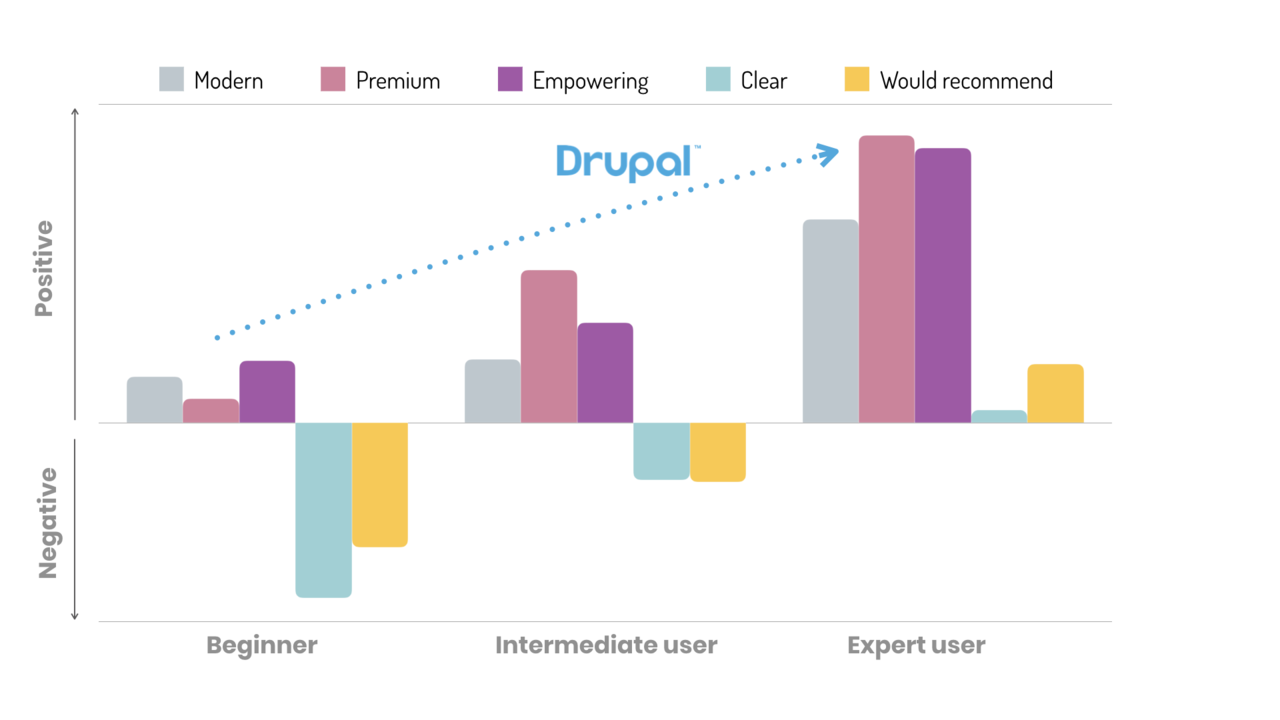 Beginners struggle with Drupal while experts love Drupal.
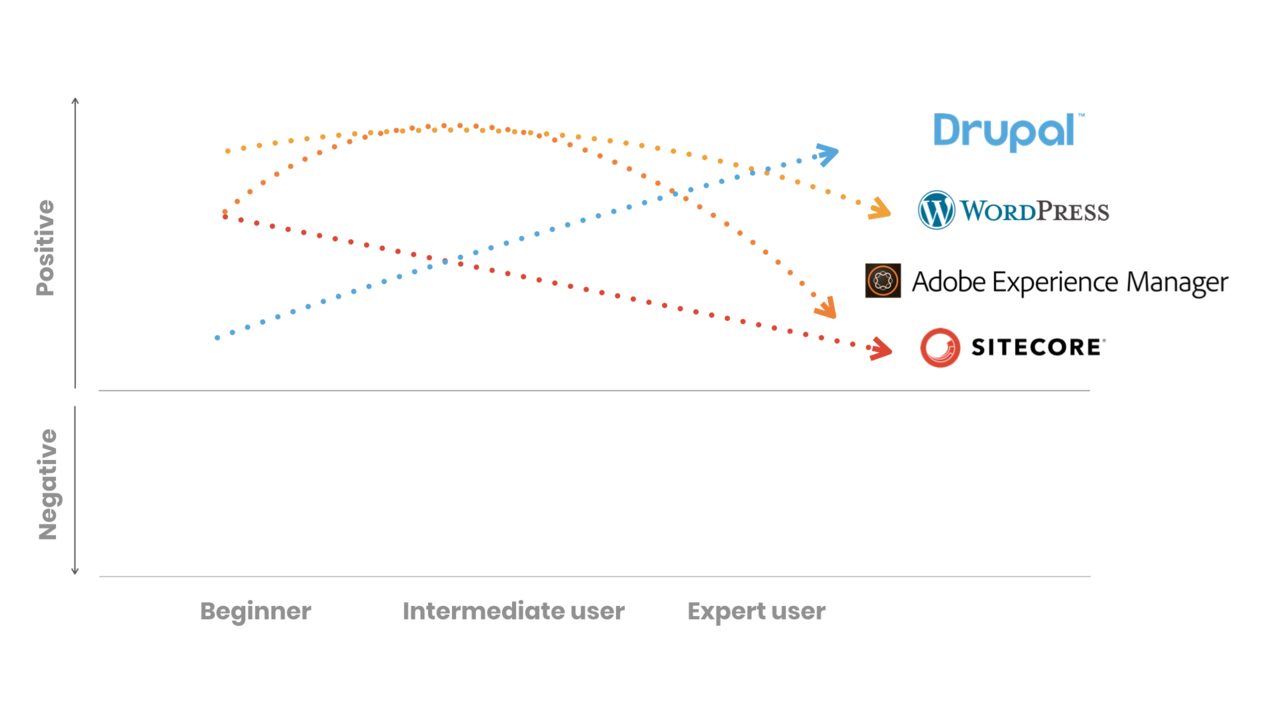 Drupal's sentiment curve goes in the opposite direction of WordPress', AEM's and Sitecore's. This presents both a big challenge and opportunity for Drupal.
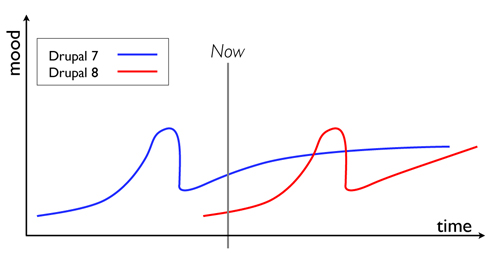
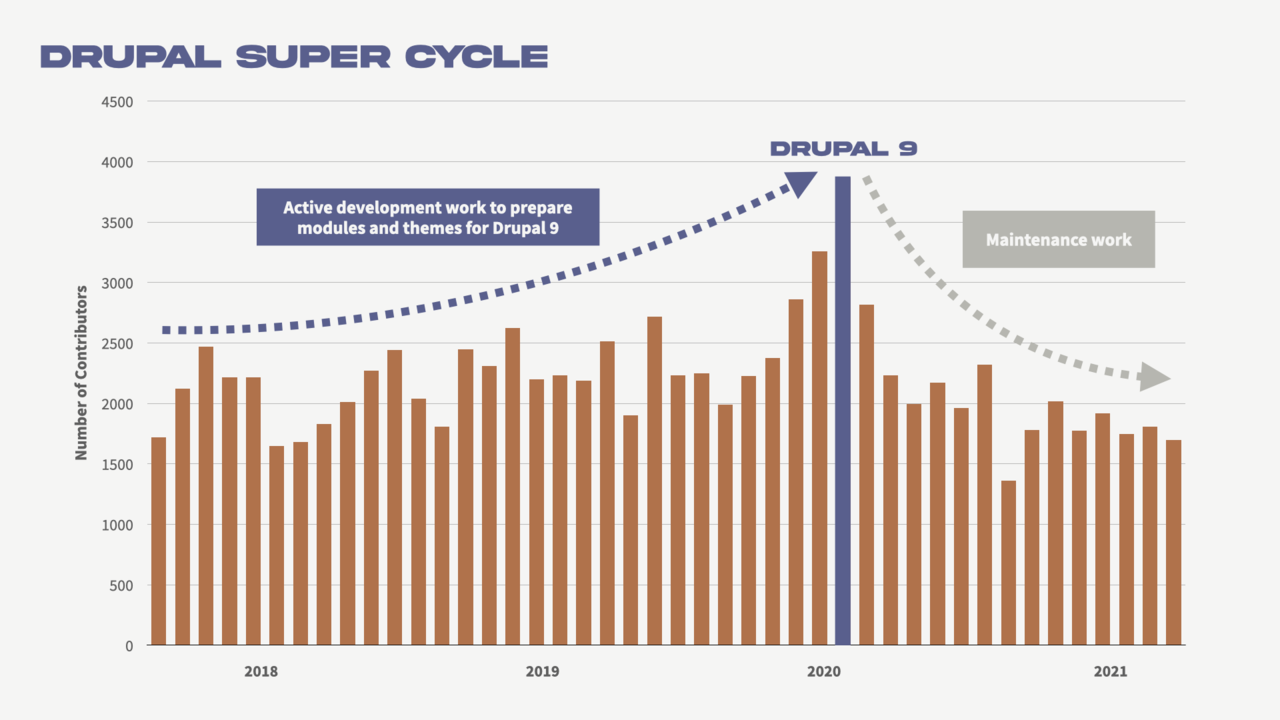 A slide from the my DrupalCon Europe 2021 keynote where I explain the Drupal Super Cycle theory.
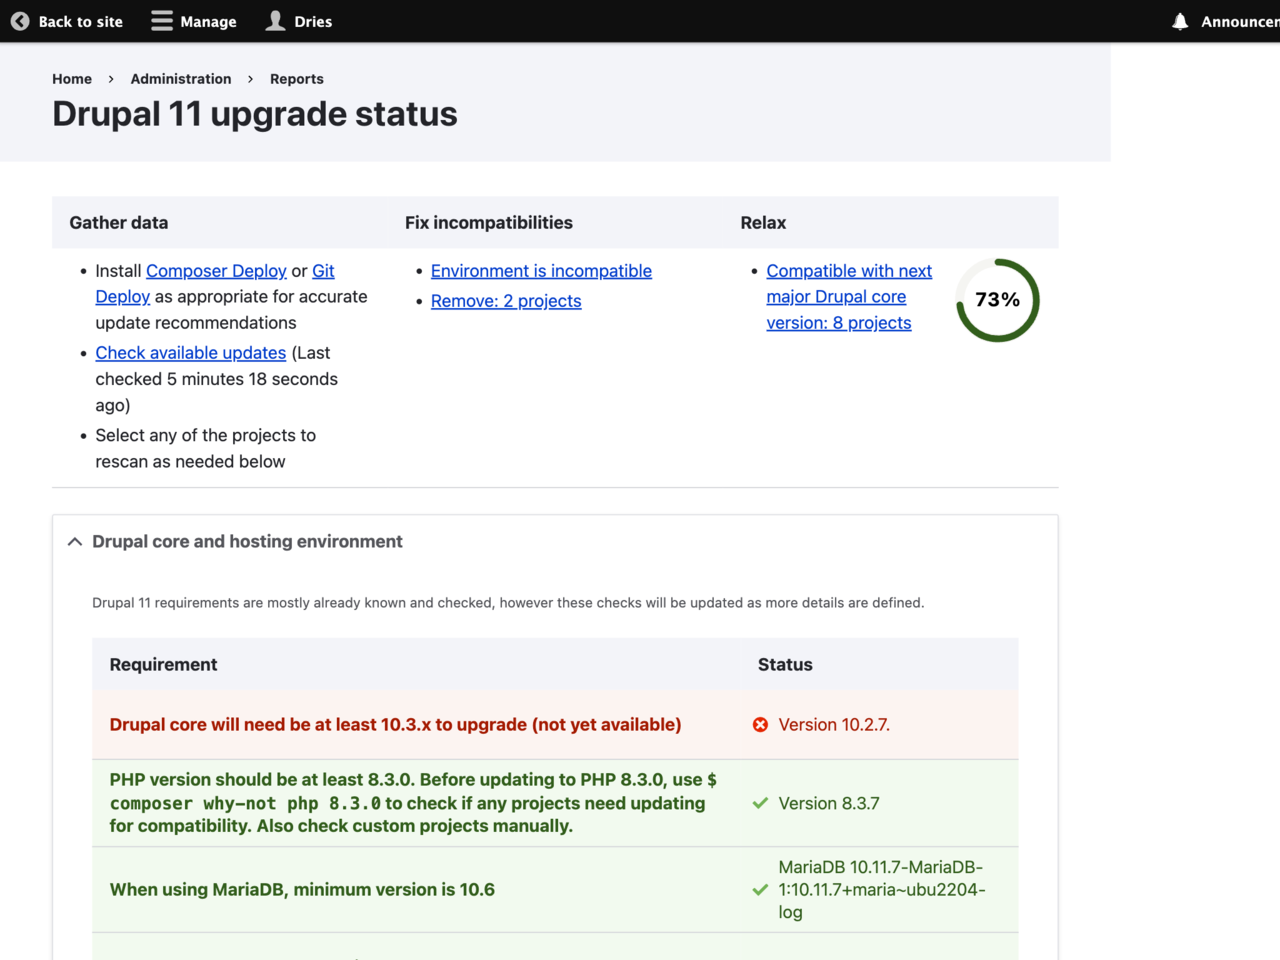 Screenshot of a Drupal upgrade status report showing hosting environment compatibility checks.

 © Development Seed.
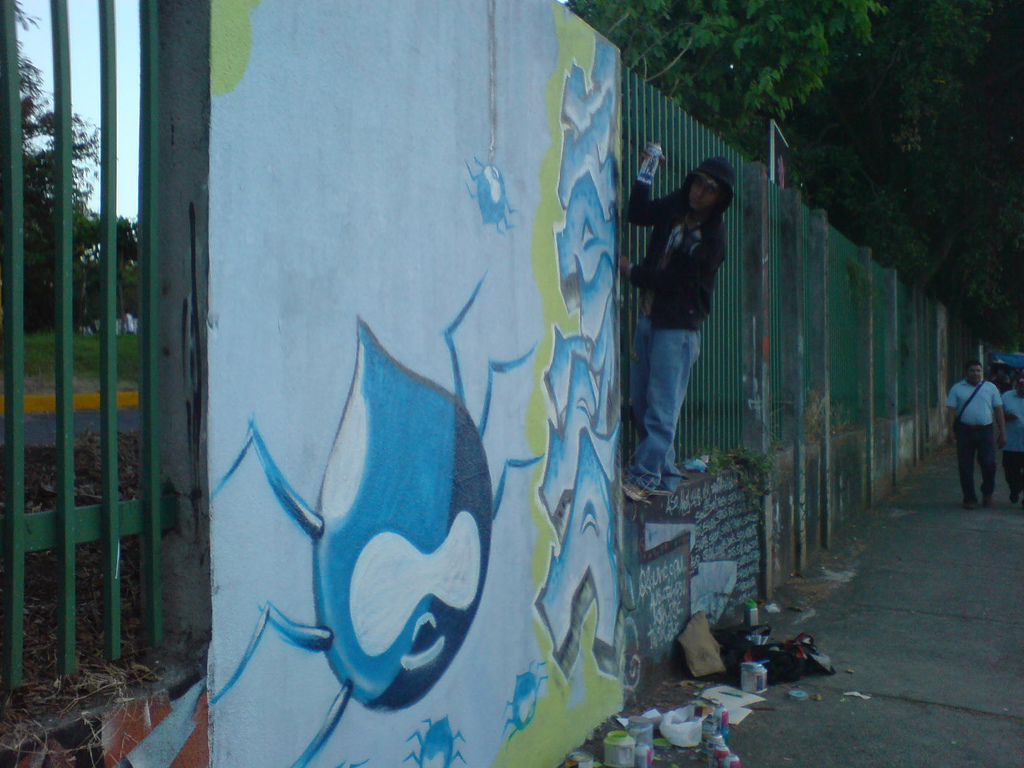 © Xamanu.
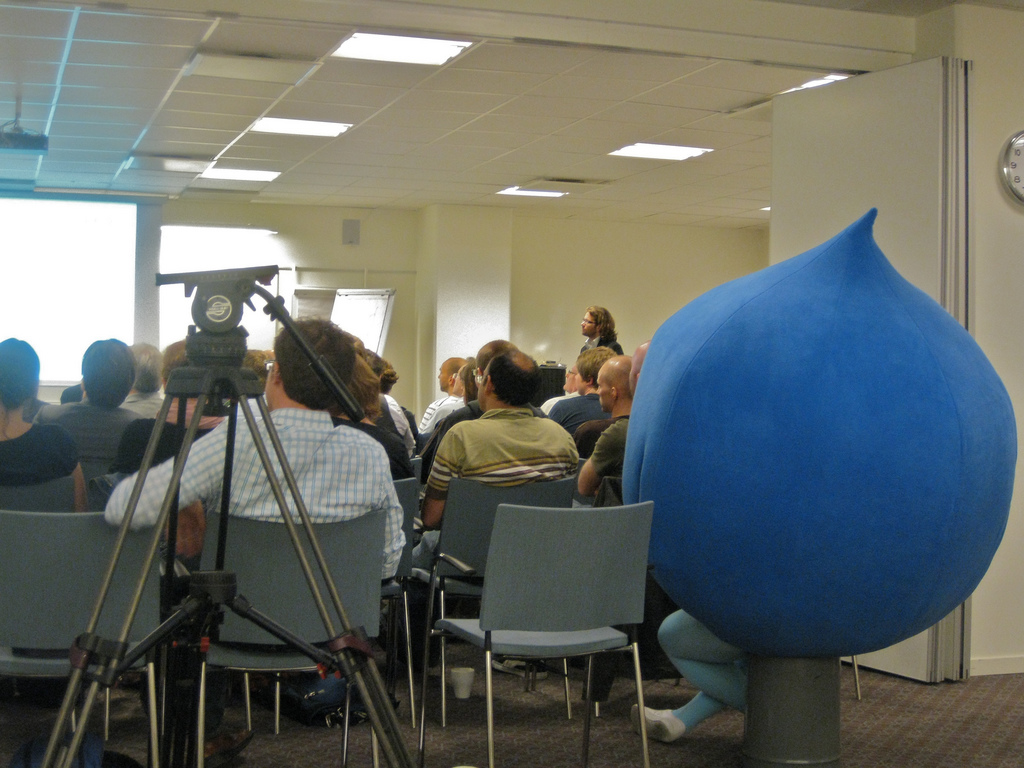 © add1sun.
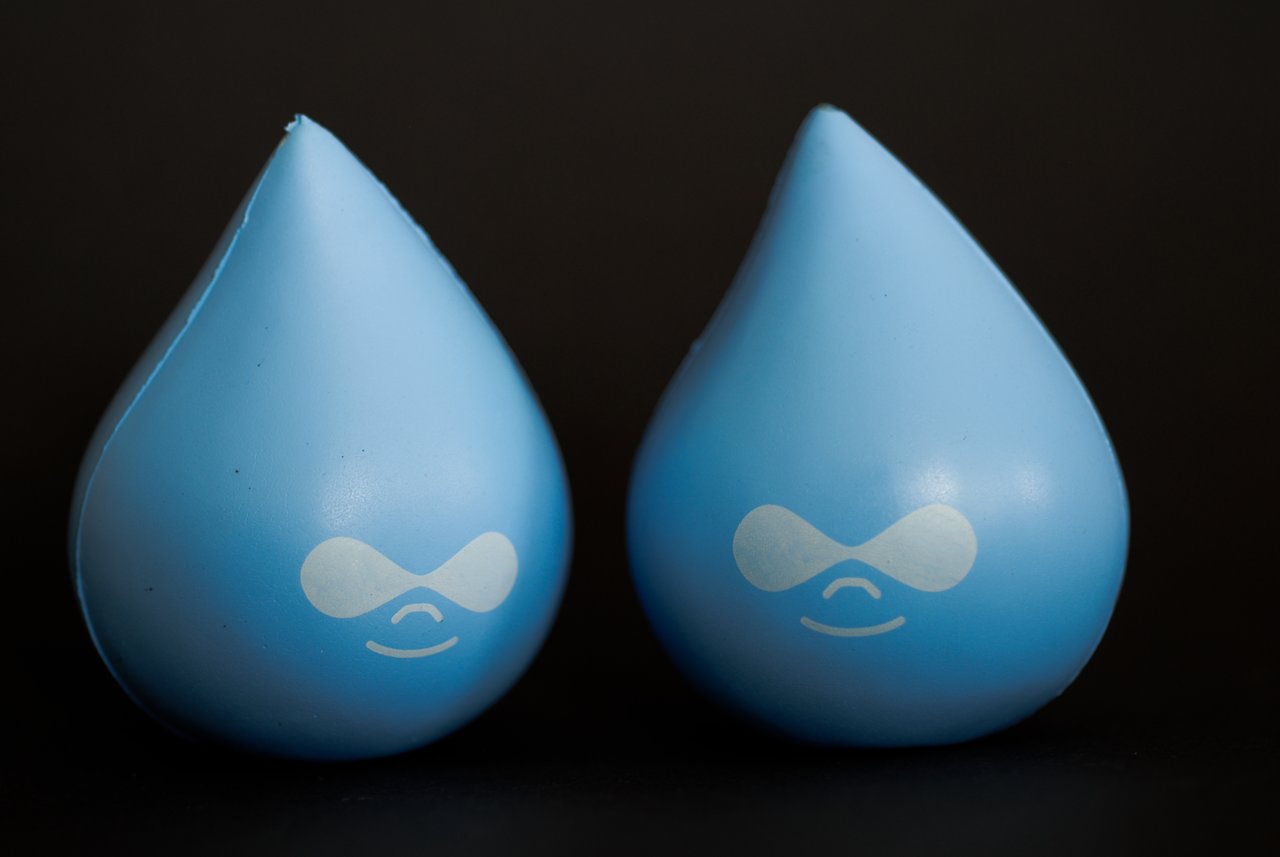 Druplicon stress balls ... sometimes one needs them. Created and distributed by Ixis.






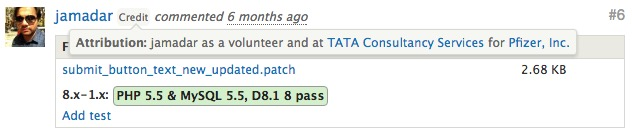 A screenshot of an issue comment on Drupal.org. You can see that jamadar worked on this patch as a volunteer, but also as part of his day job working for TATA Consultancy Services on behalf of their customer, Pfizer.

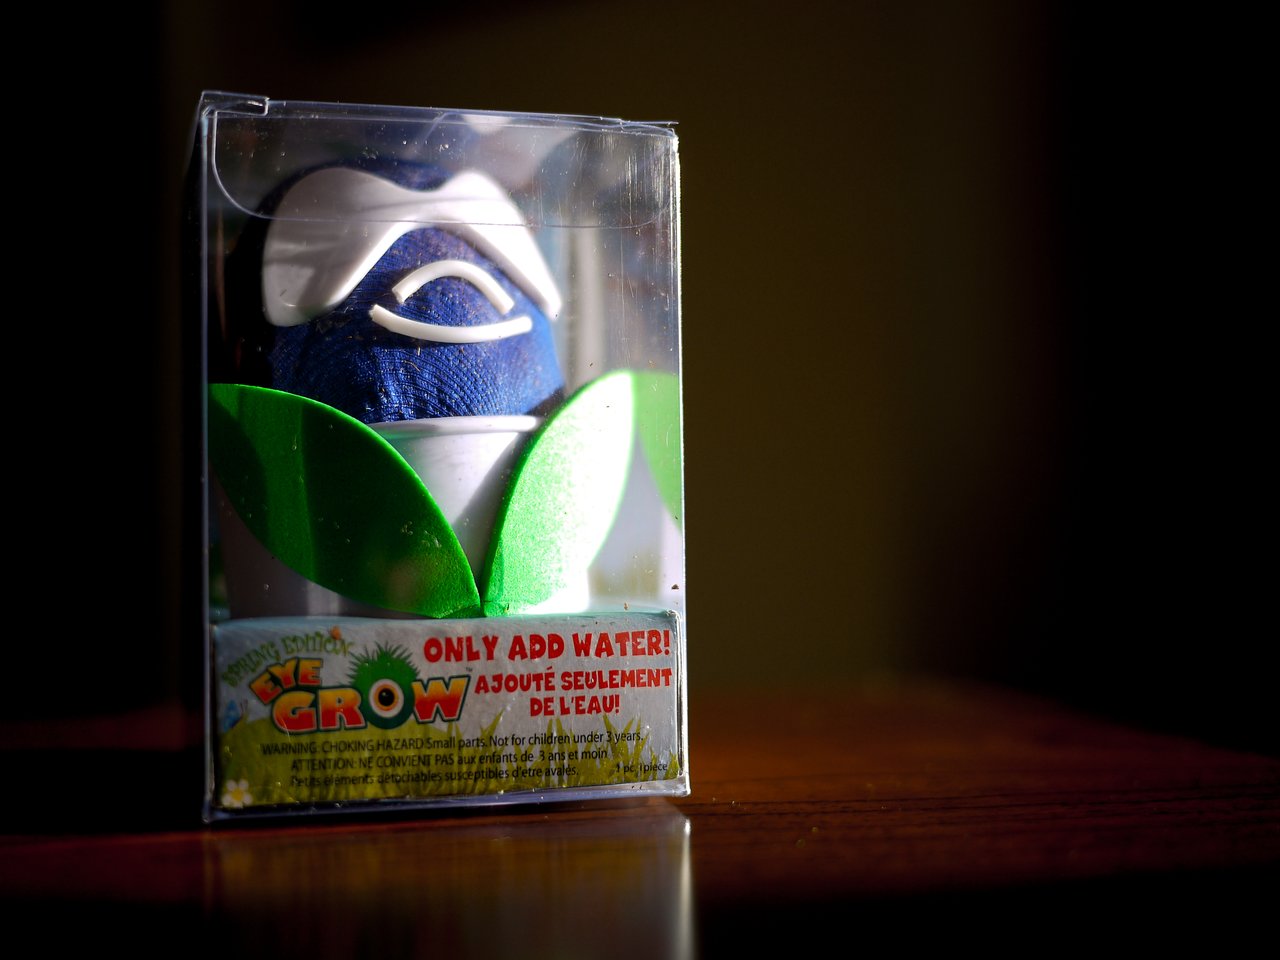
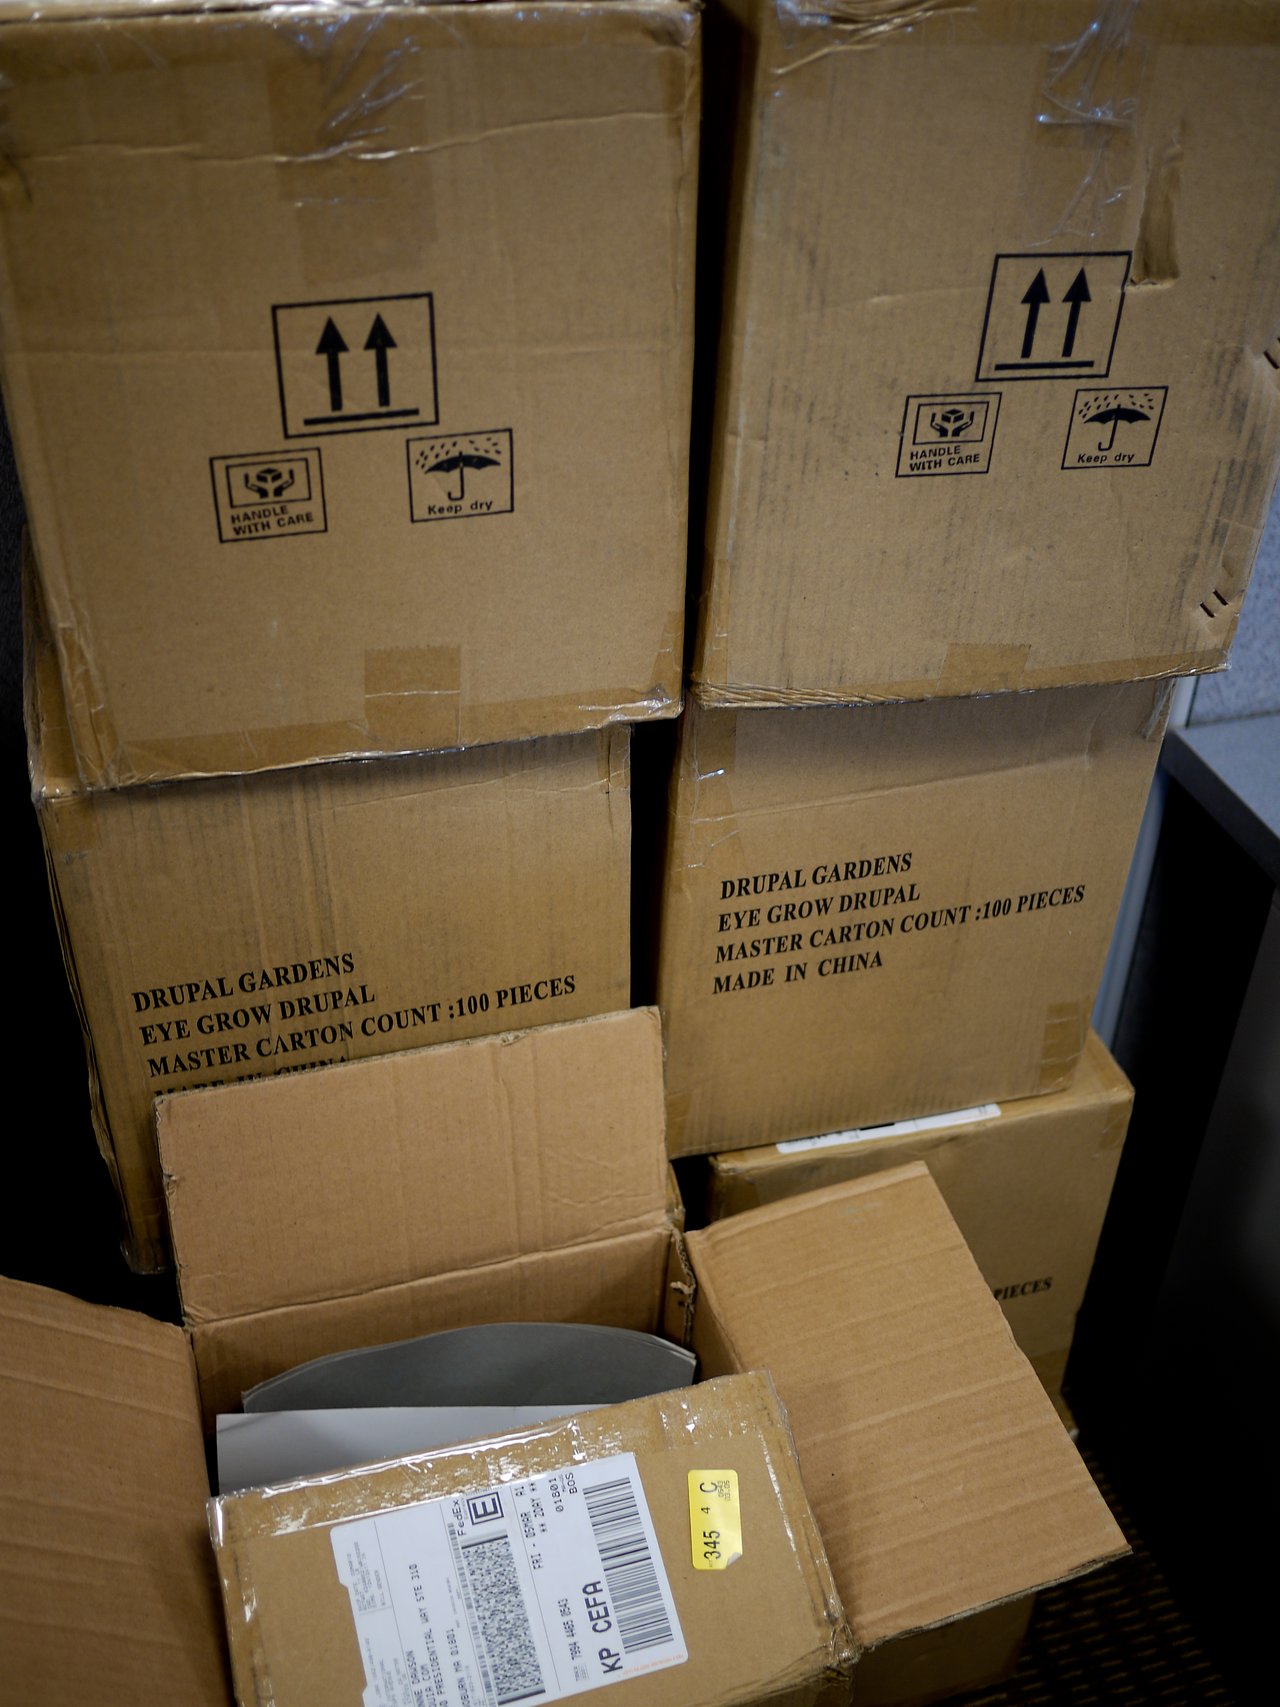 Guess what is in these boxes?

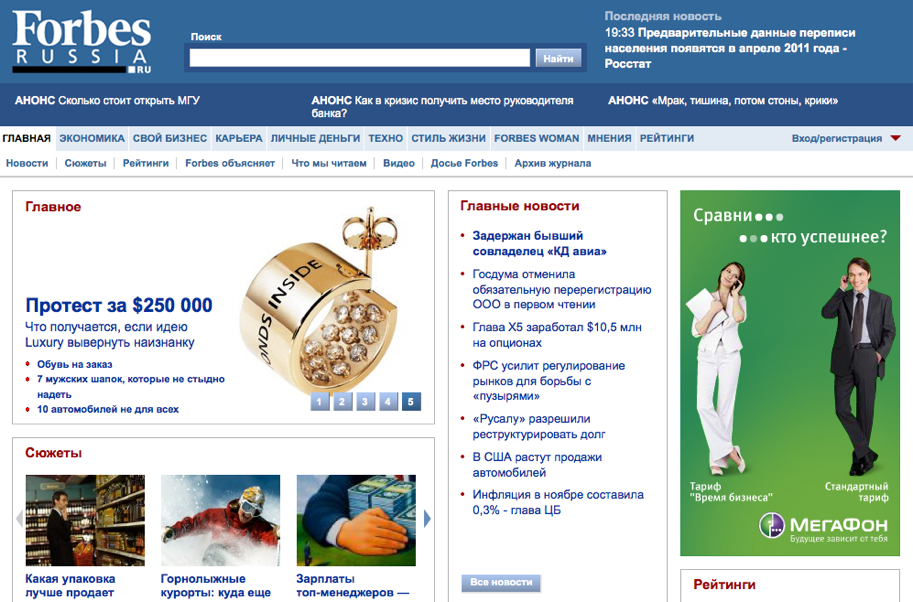
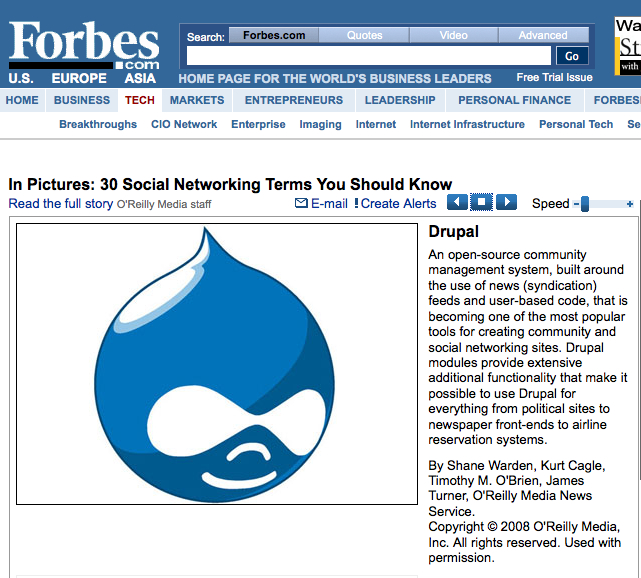 Drupal was mentioned in Forbes as part of an article called "Social networking terms you should know". Great to see our work being recognized by Forbes. *Super!*
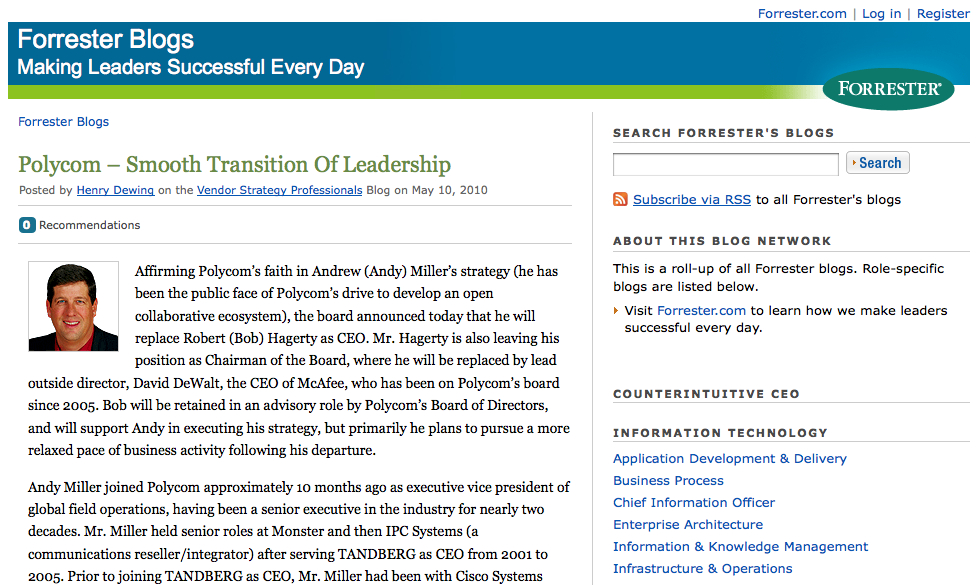
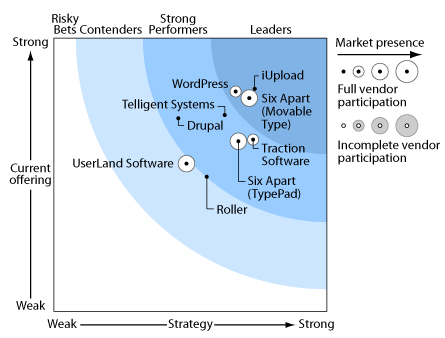 Source: Charlene Li's weblog. © Forrester Research.
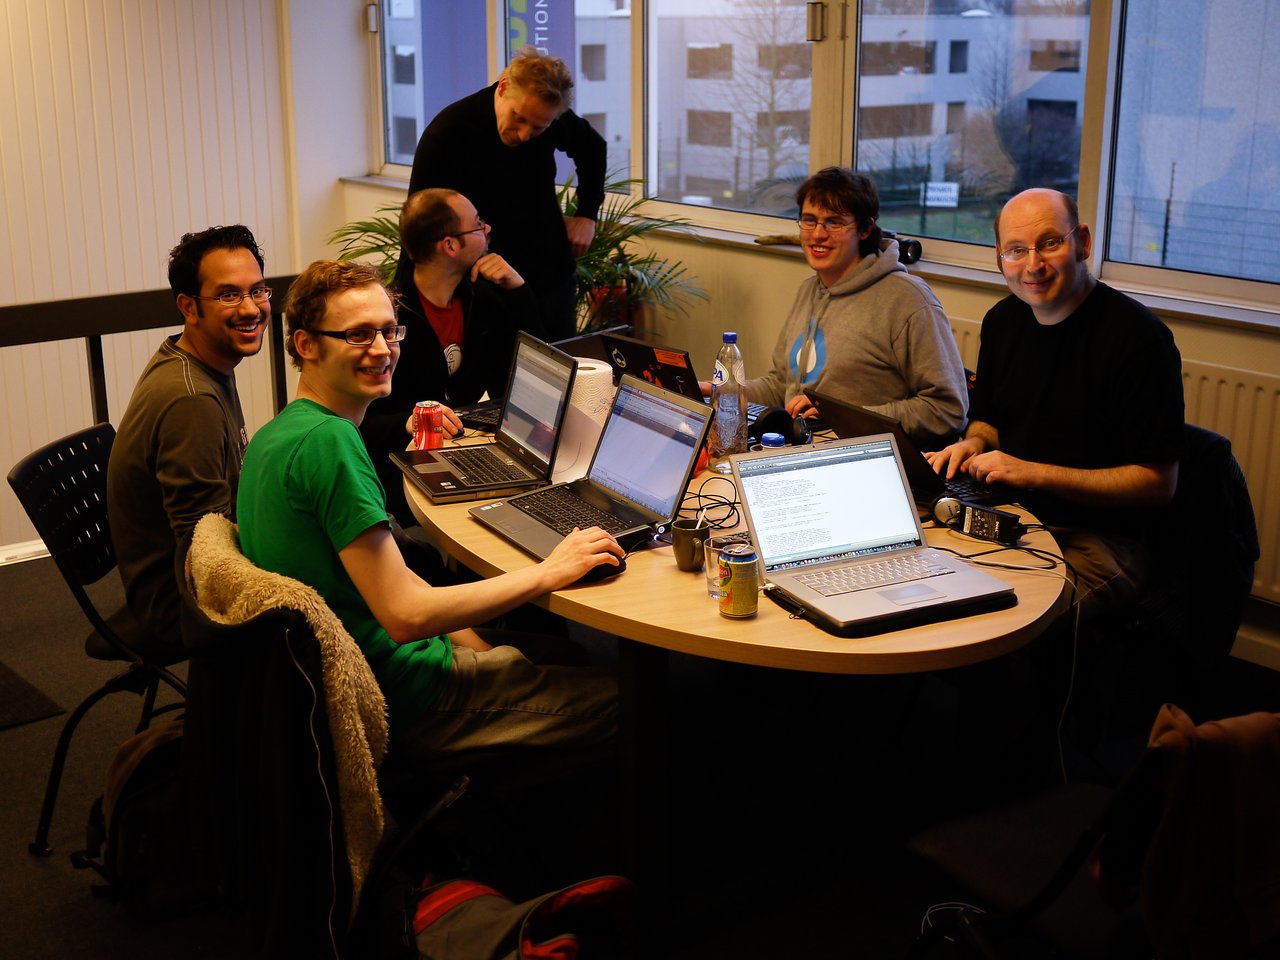 With chx, dereine, seutje, mrbaileys, Bojhan and myself working Drupal 7 core and the Drupal 7 upgrade of Views.


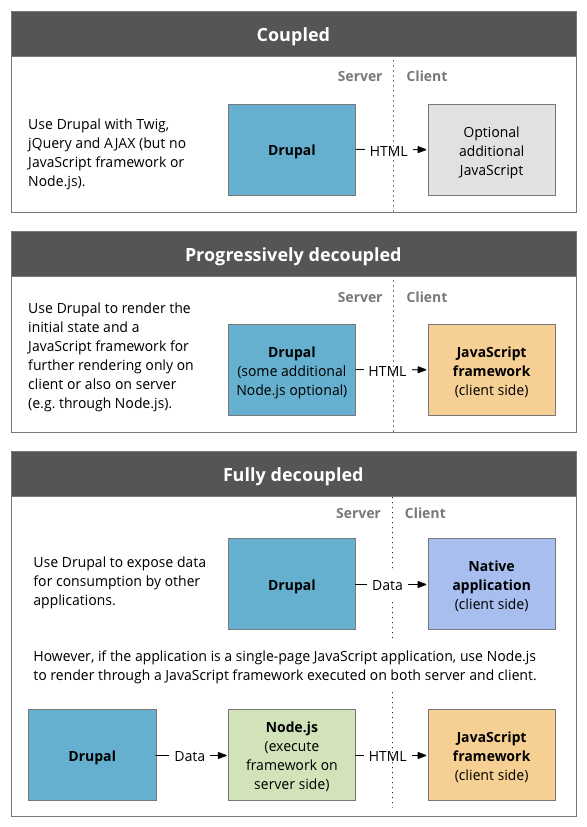
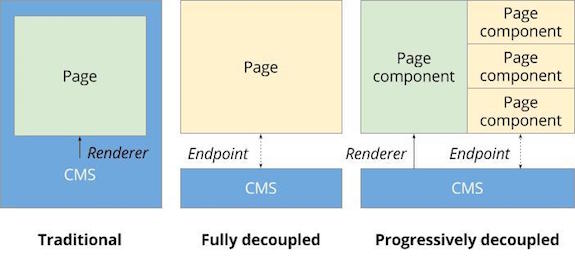 Under progressive decoupling, the CMS renderer still outputs the skeleton of the page.
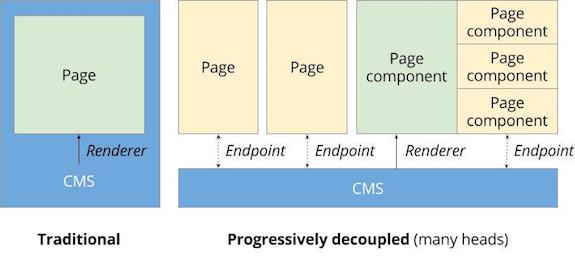 In the case of many-headed Drupal, fully decoupled applications can live alongside progressively decoupled pages, whose skeletons are rendered through the CMS.
 Traditional ("monolithic") versus fully decoupled ("headless") architectural paradigm.
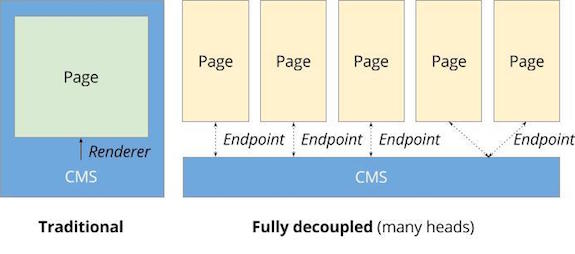 In a fully decoupled architecture, the theme layer is often ignored altogether, and many content management capabilities are lost, though many clients ingesting data are possible.

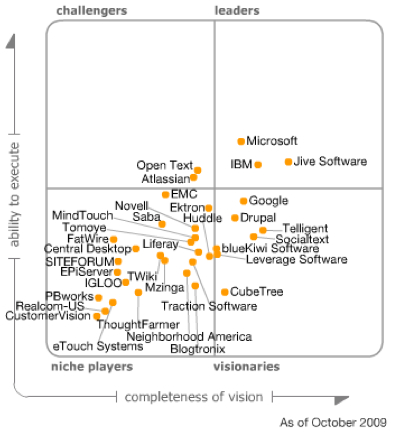



 © Jamey Boje.
 © Jamey Boje.

 © Ruth Black.
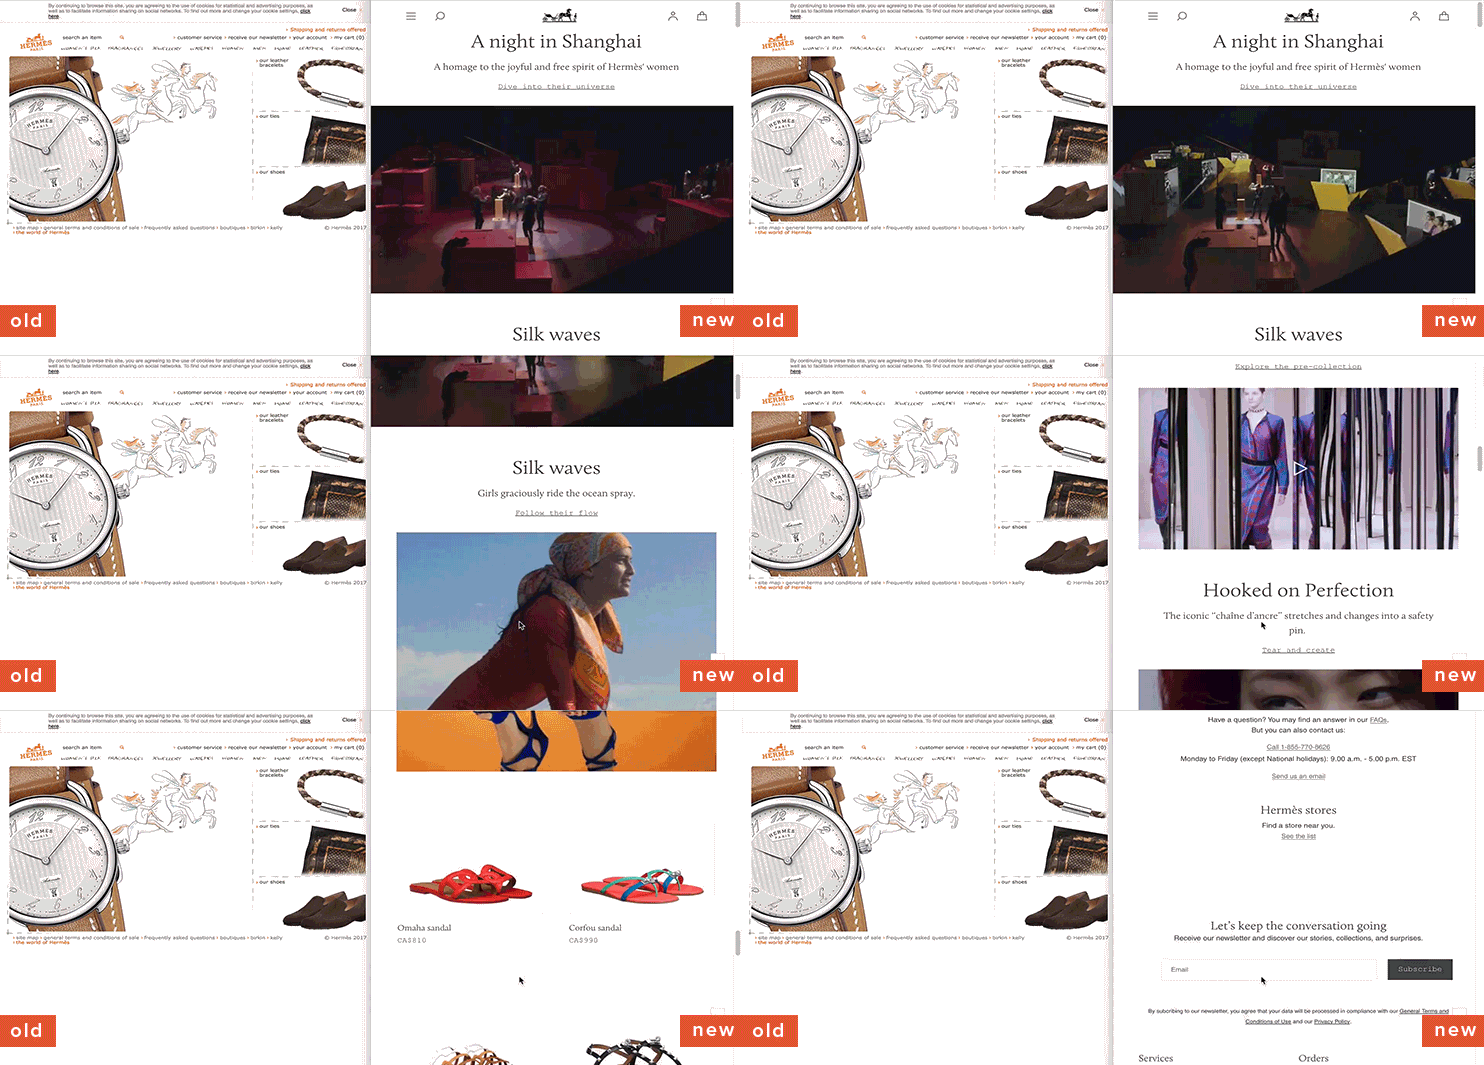


 Over the past year, JavaScript frameworks have become more complex, while static site generators have become less complex.

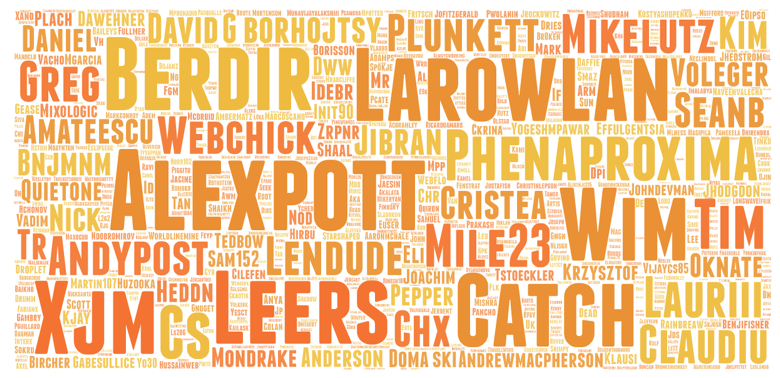 Thanks to the 641 individuals who worked on Drupal 8.8 so far.
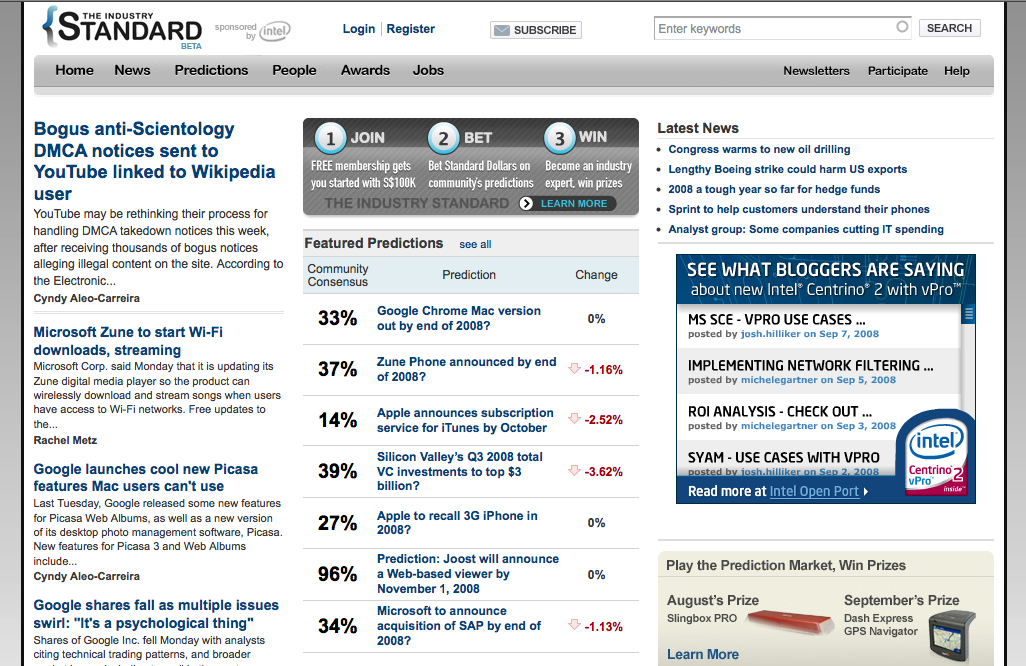

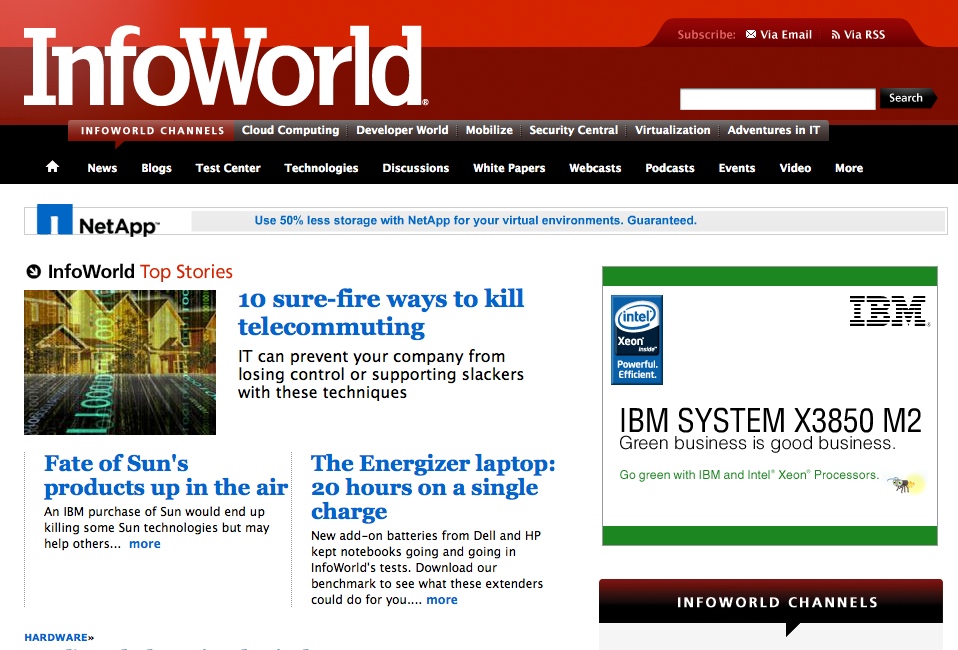

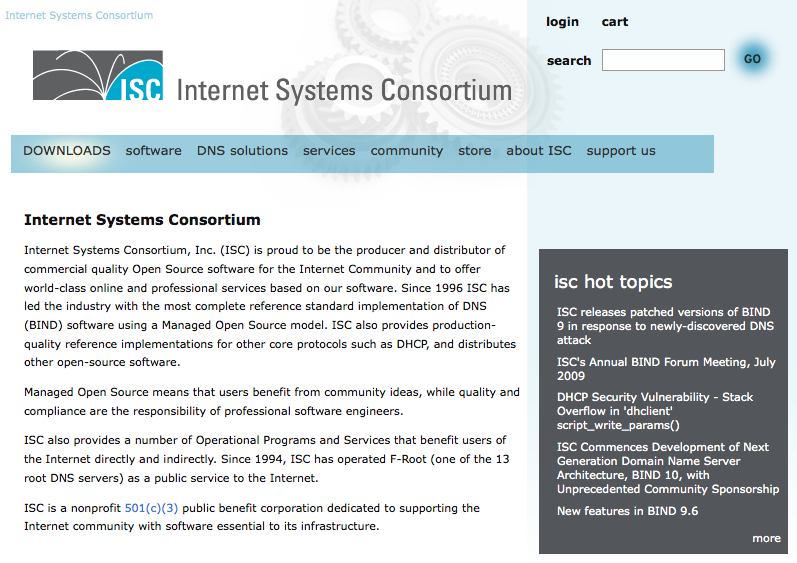

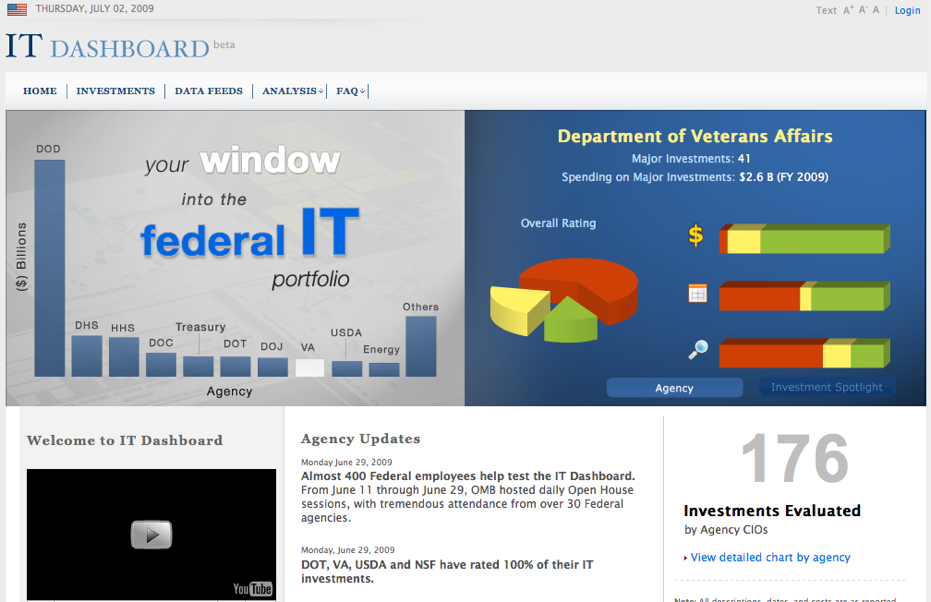
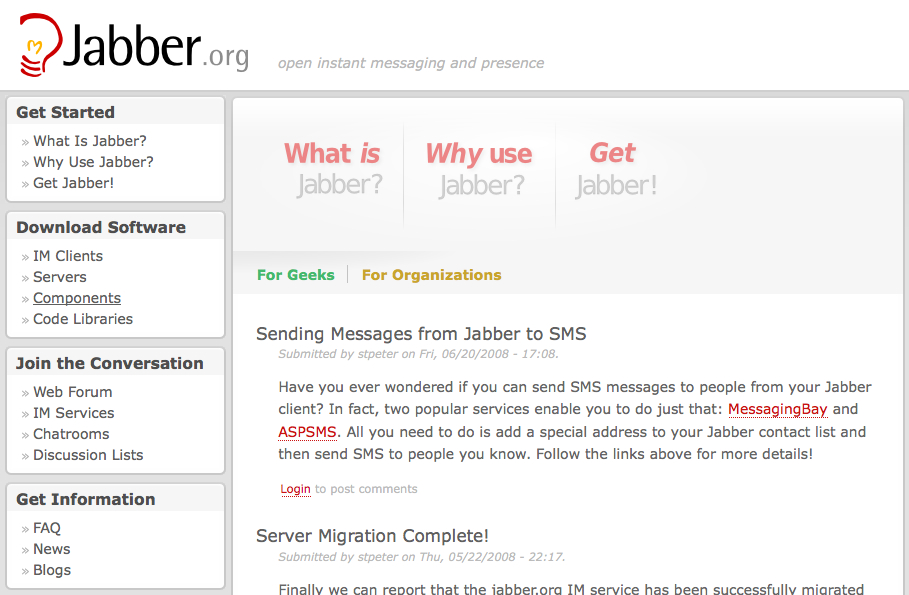
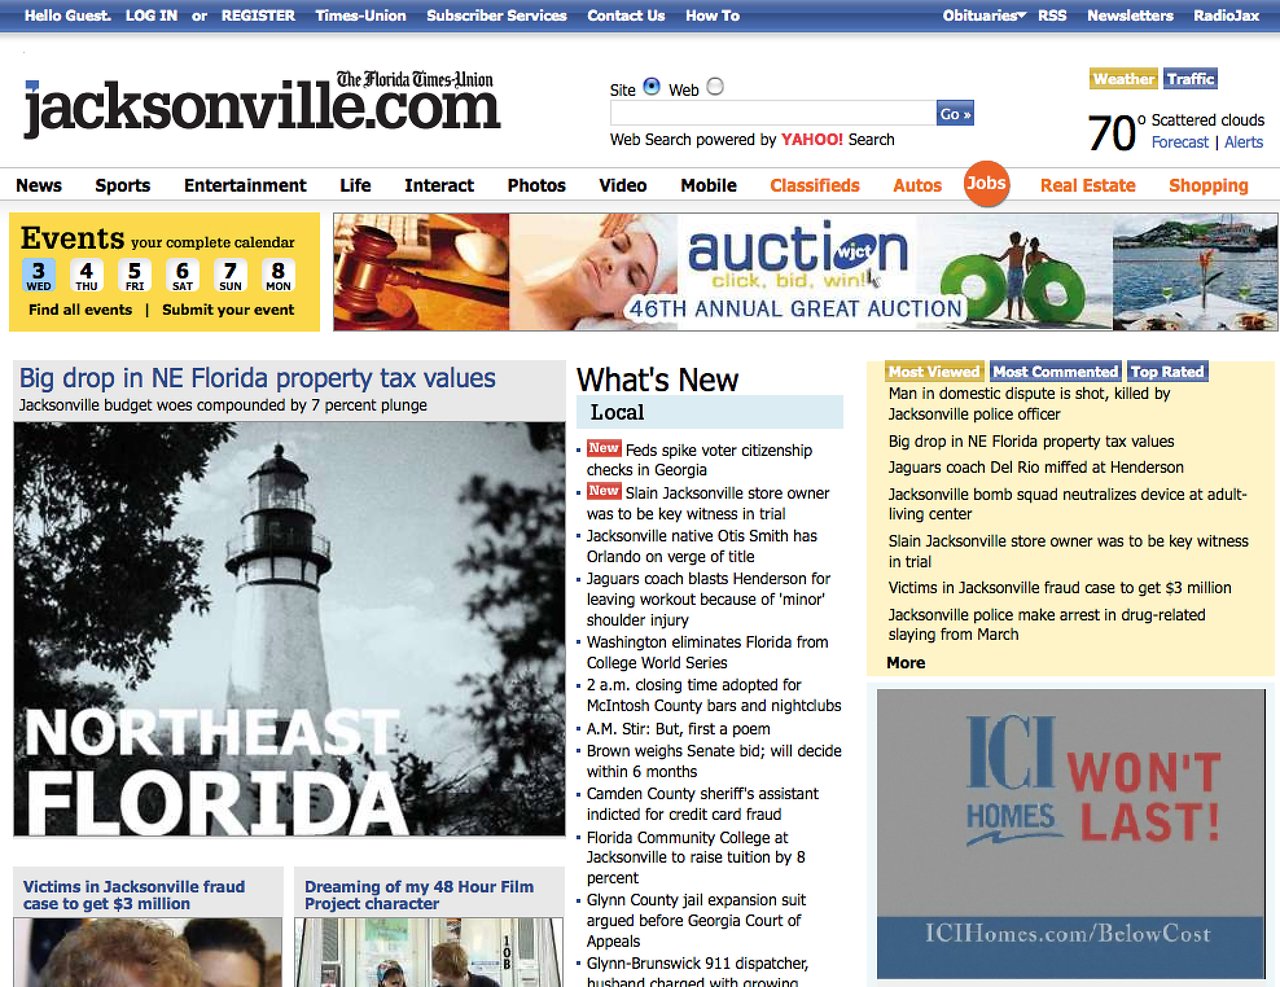

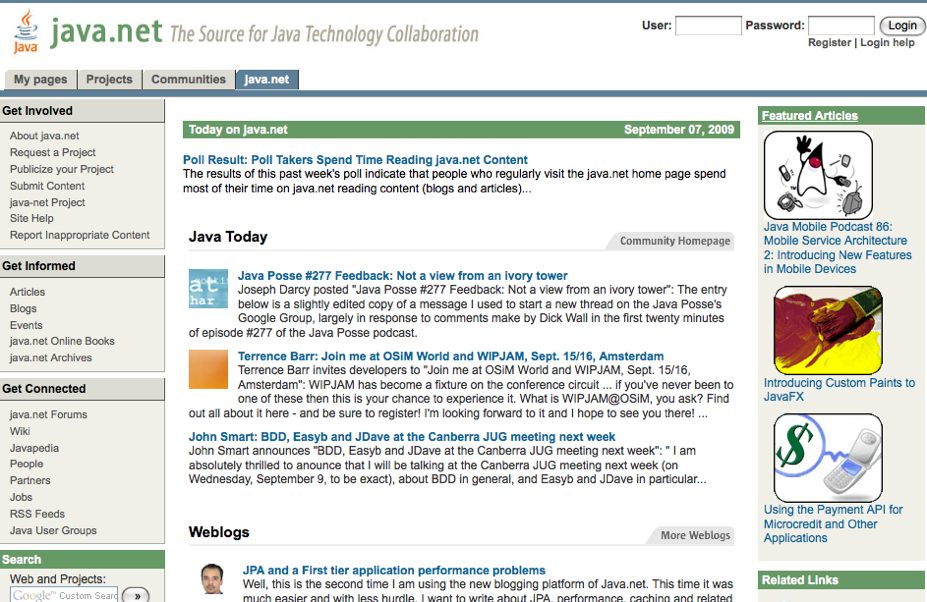
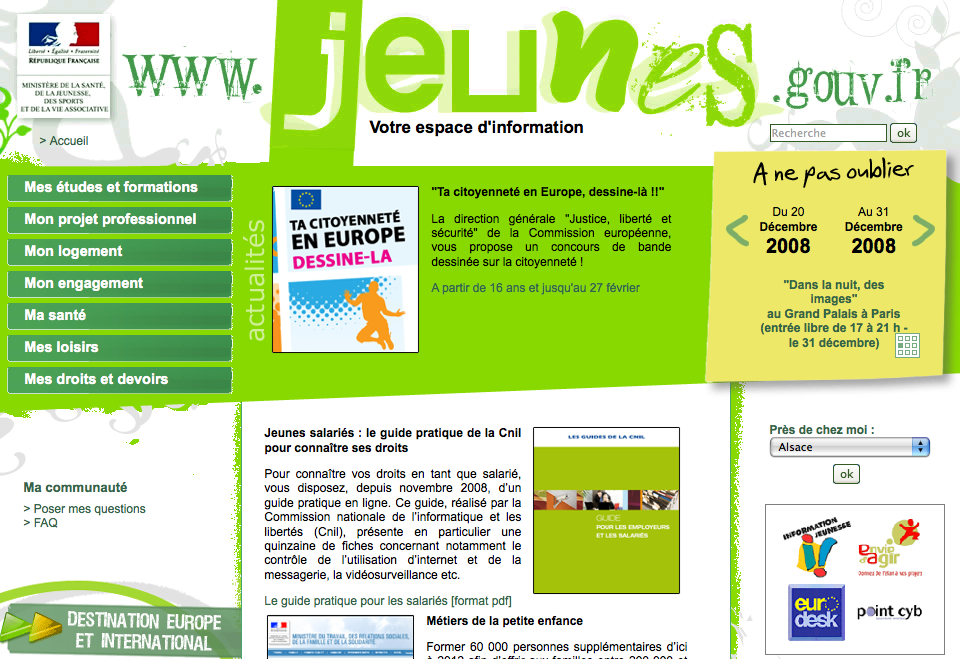
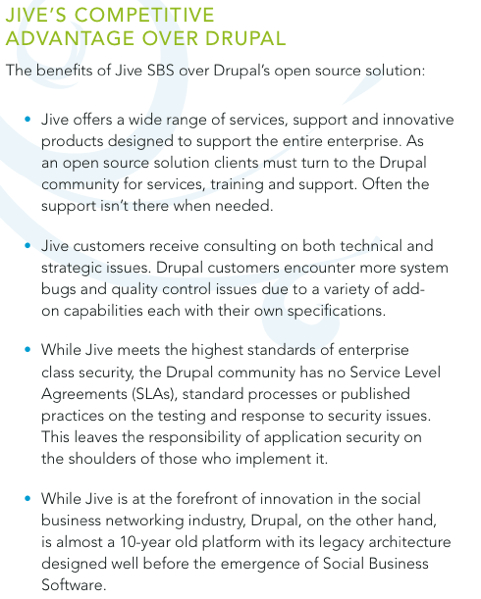 A screenshot from Jive Software's whitepaper called: "The unique advantage of Jive Social Business Software over Open Source Software". © Jive Software.
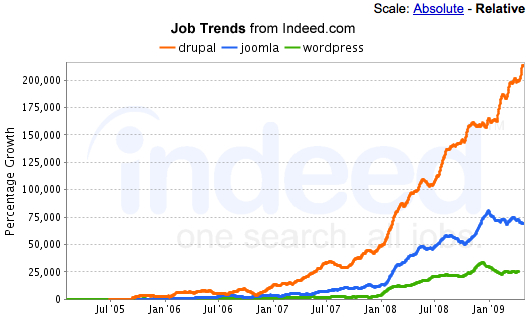 © Indeed.com.
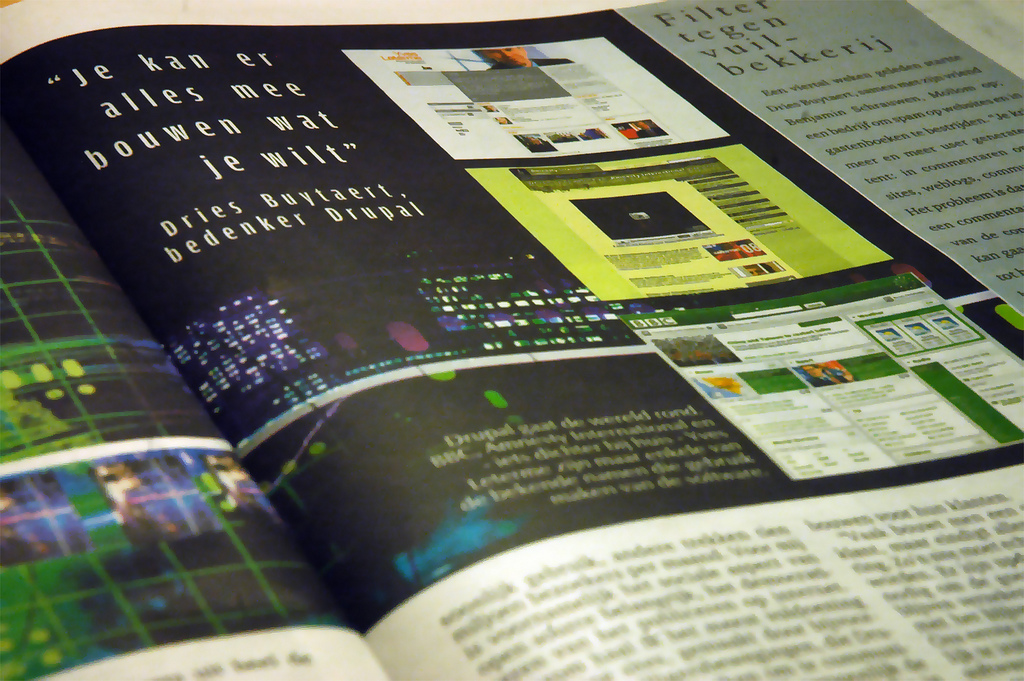 Photo taken by Joeri Poesen.


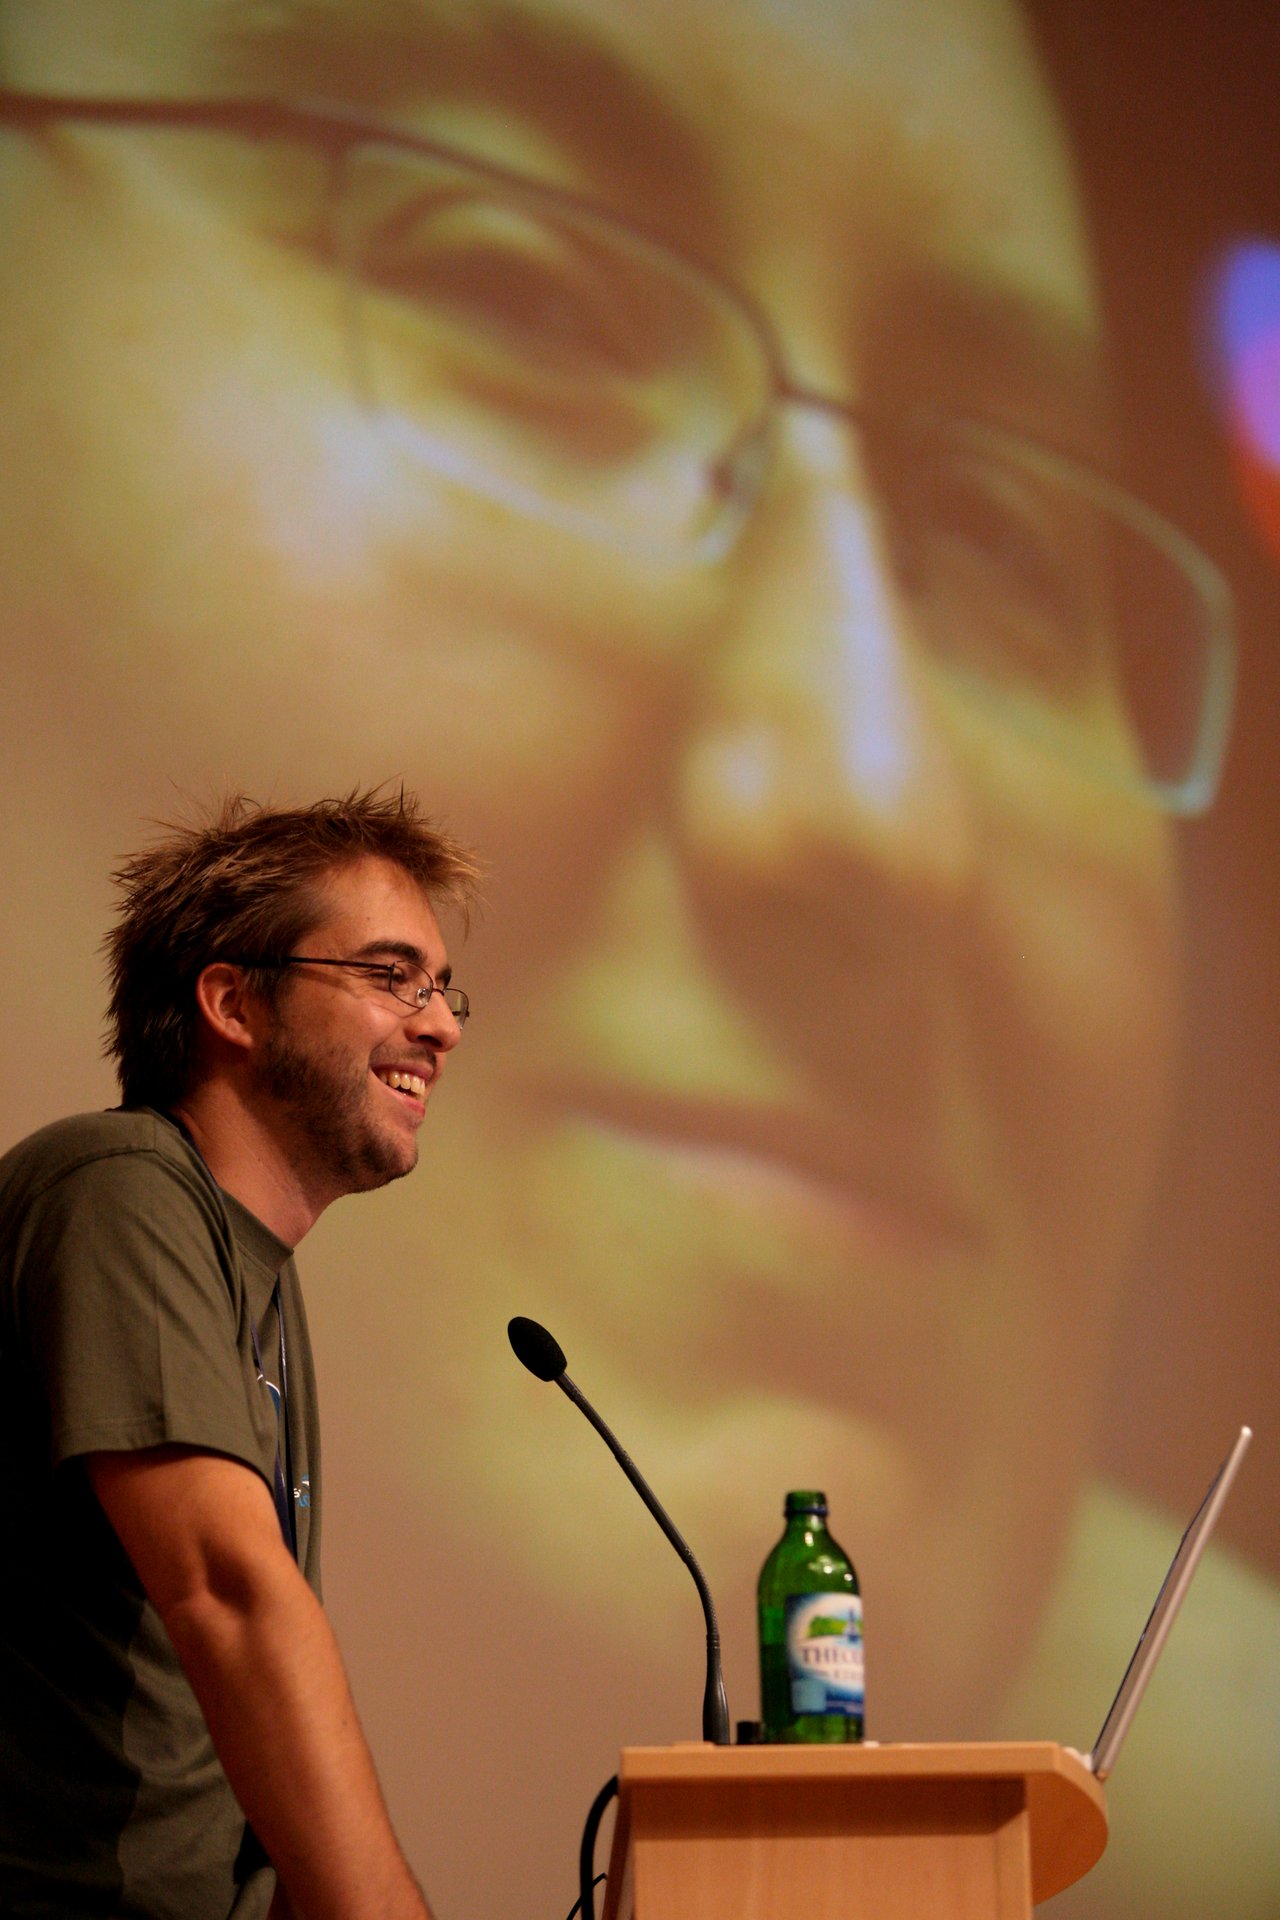 © Chrys.

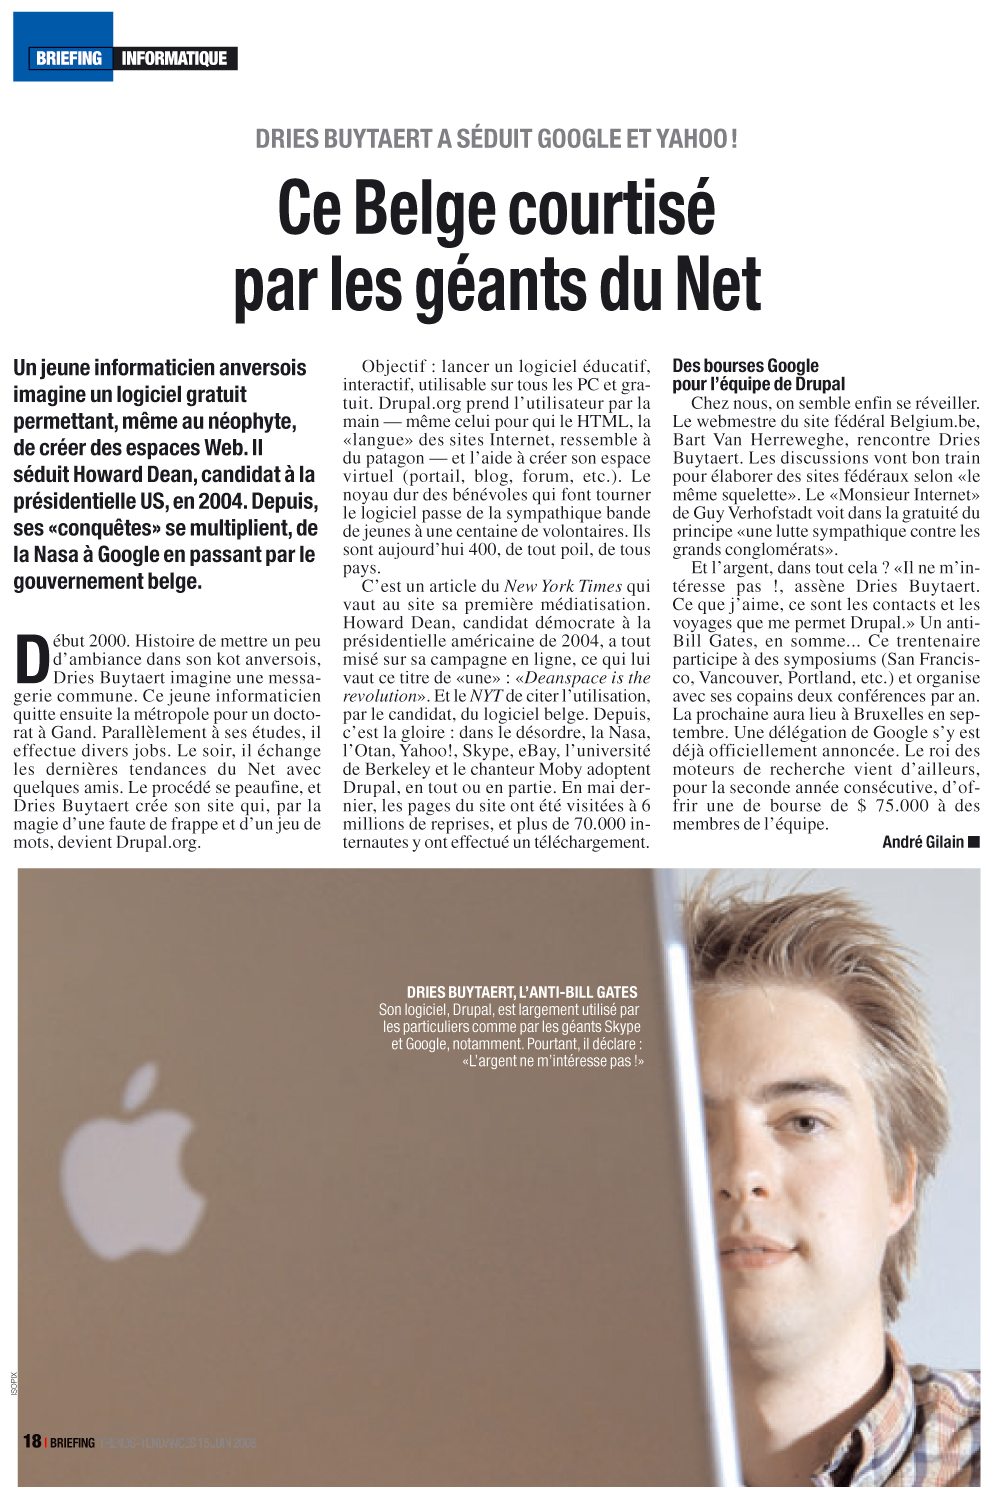
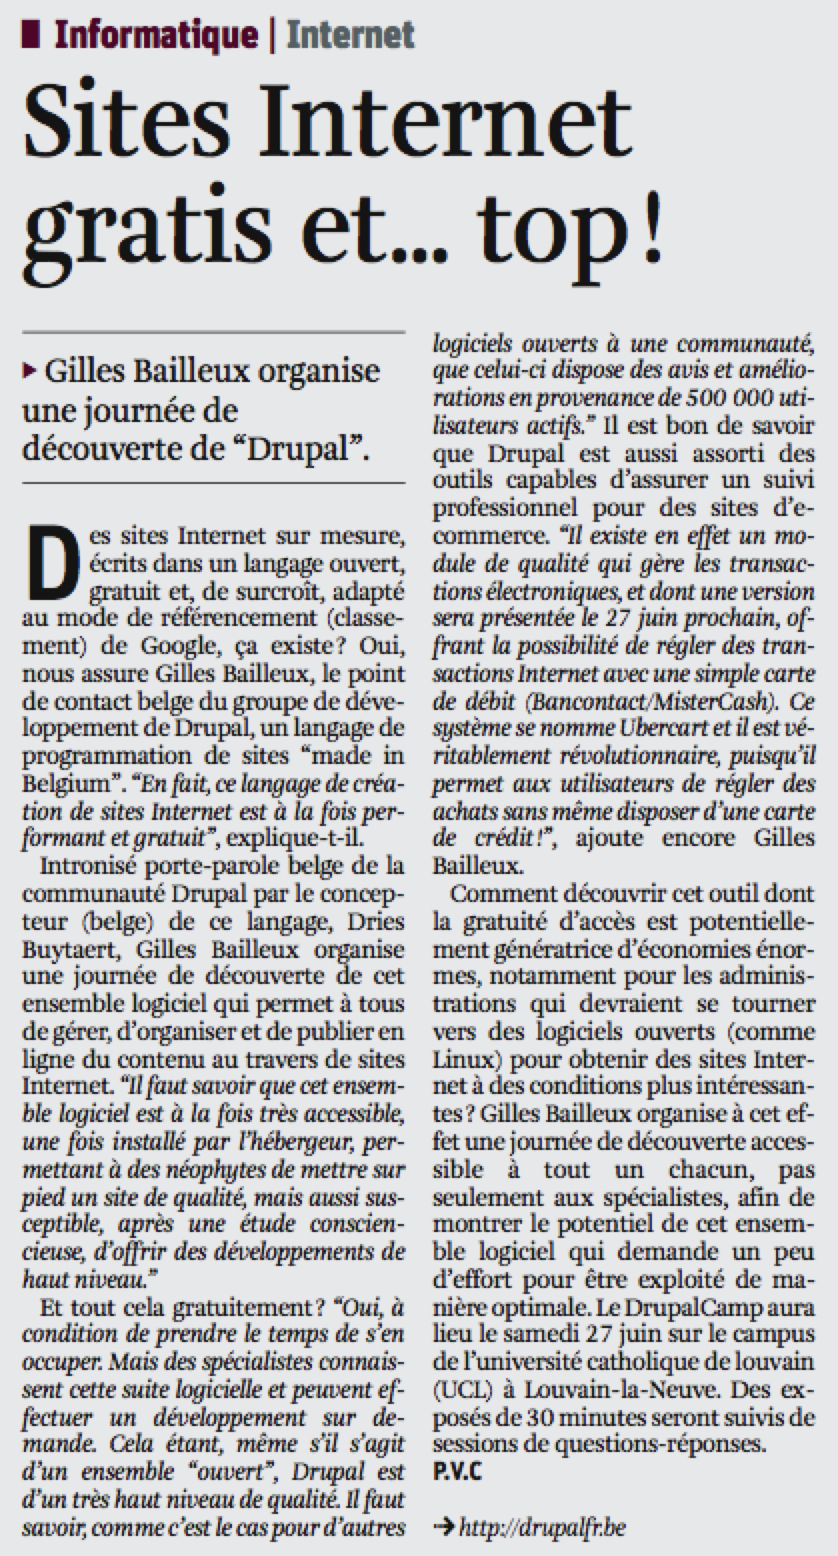 Download PDF version. © La Libre Belgique.
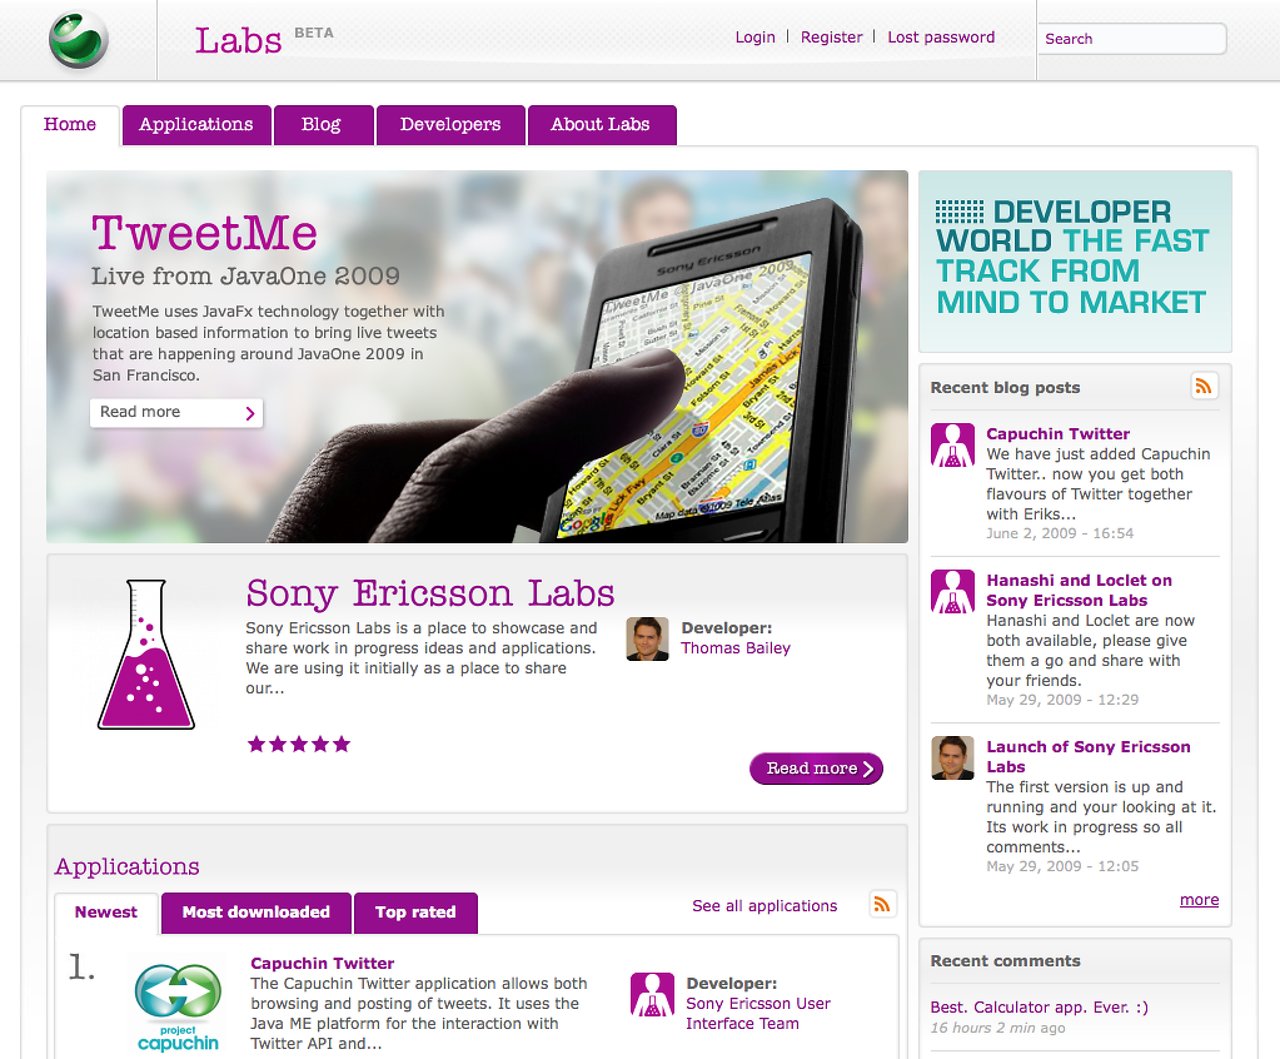



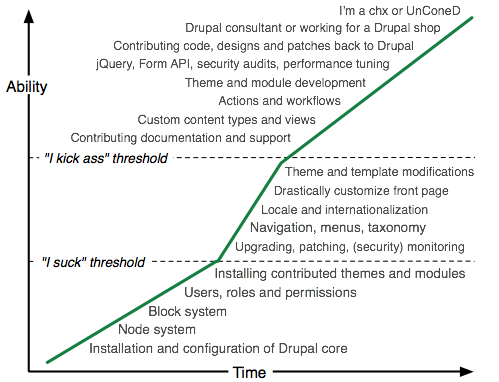 My take on Drupal's learning curve. Inspired by Creating Passionate Users.






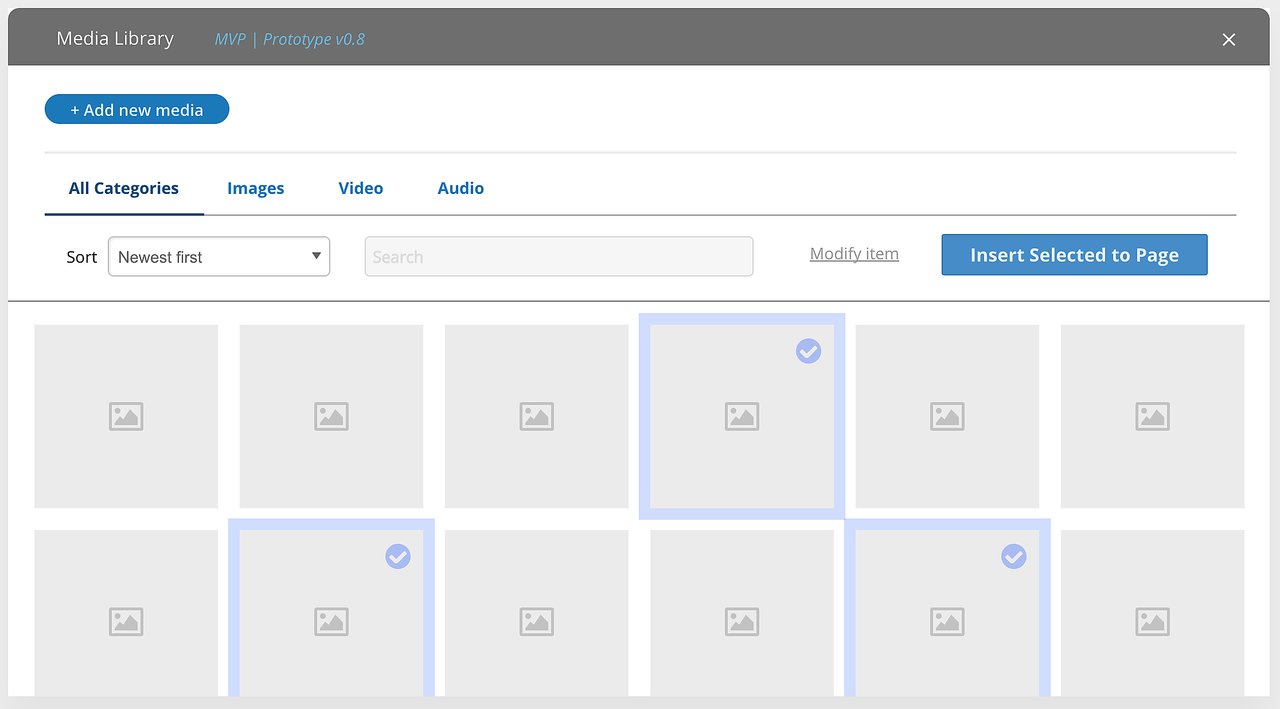 A work-in-progress prototype of the proposed media library.


 © Moby.com.

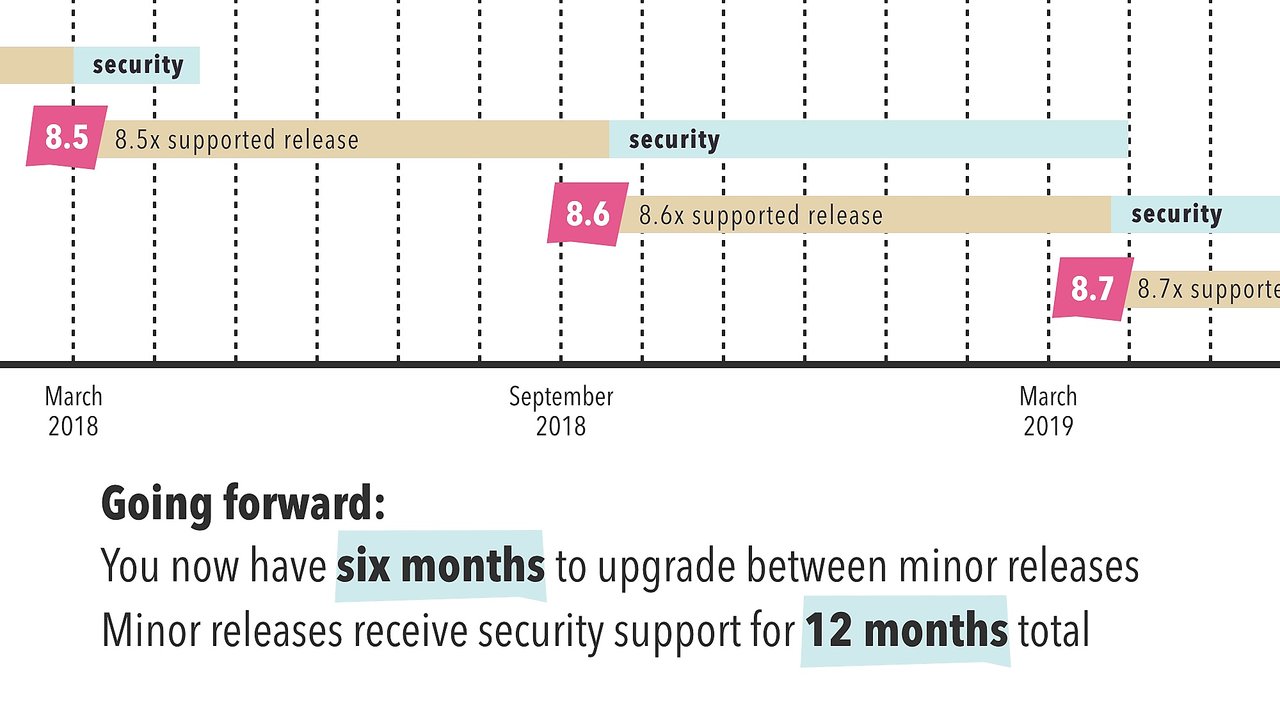 Illustration of the new security policy for minor releases, demonstrating that the security coverage for minor releases is extended to six months. Source: Drupal.org issue #2909665: Extend security support to cover the previous minor version of Drupal and the Drupal Europe DriesNote.

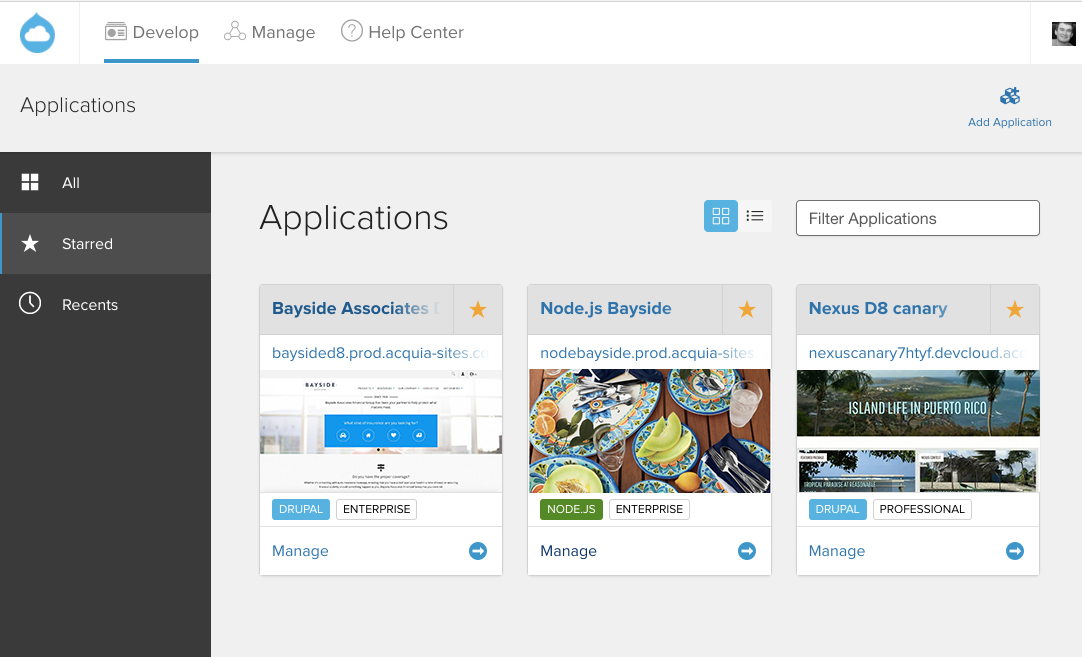 On Acquia Cloud, customers can access Drupal and Node.js environments from a single user interface.
 According to Bitcoin's GitHub data, Bitcoin has less than 40 active contributors.
 According to Ethereum's GitHub data, Ethereum has less than 20 active contributors.
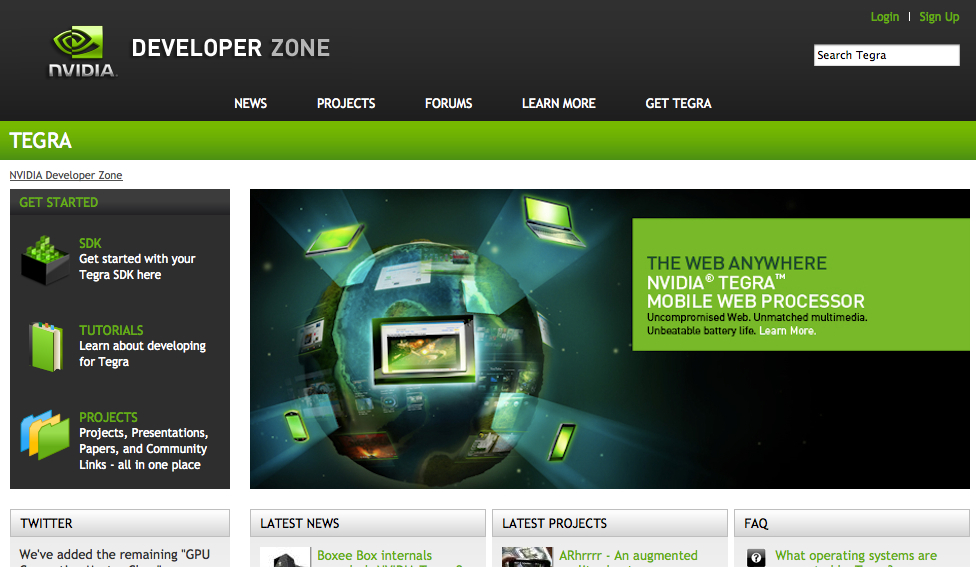

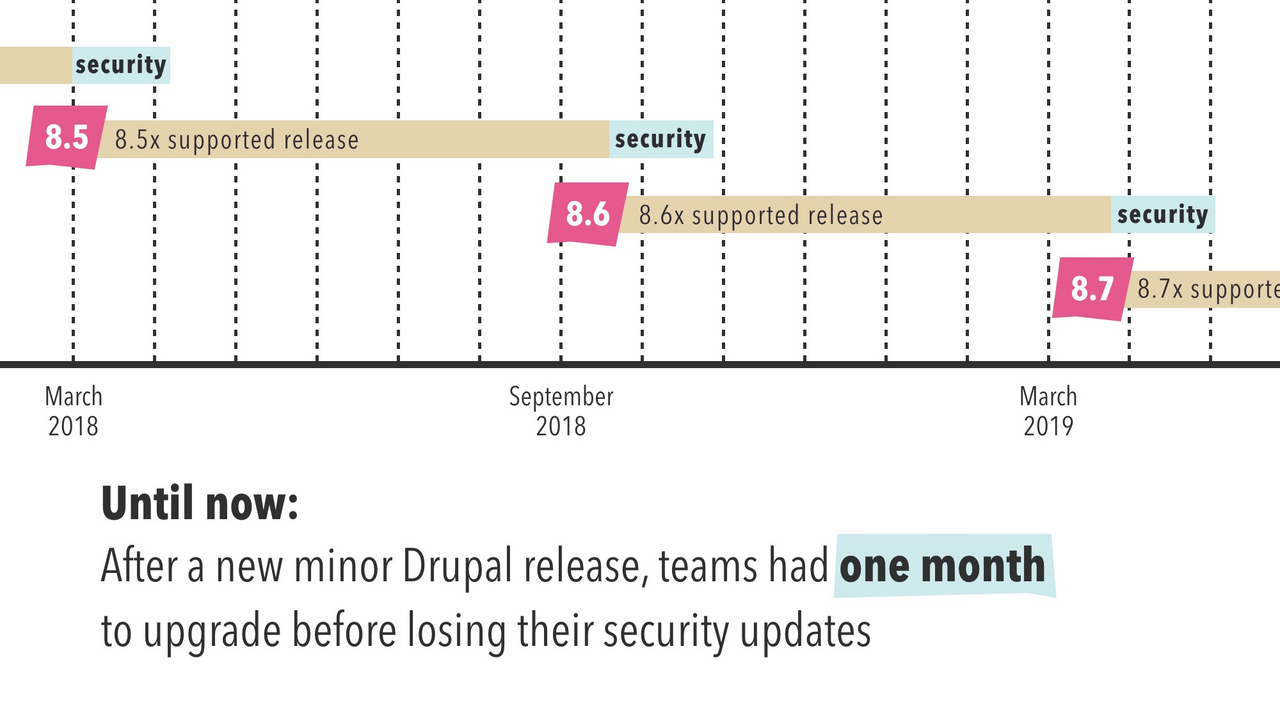 Illustration of the security policy since the launch of Drupal 8.0 for minor releases, demonstrating that previous minor releases receive one month of security coverage.Source: Drupal.org issue #2909665: Extend security support to cover the previous minor version of Drupal and Drupal Europe DriesNote.
 The core pillars of Drupal's Open Web Manifesto include freedom, decentralization, inclusion, participation and empowerment. These are all themes I've spoken about during my Driesnote presentations over the years.

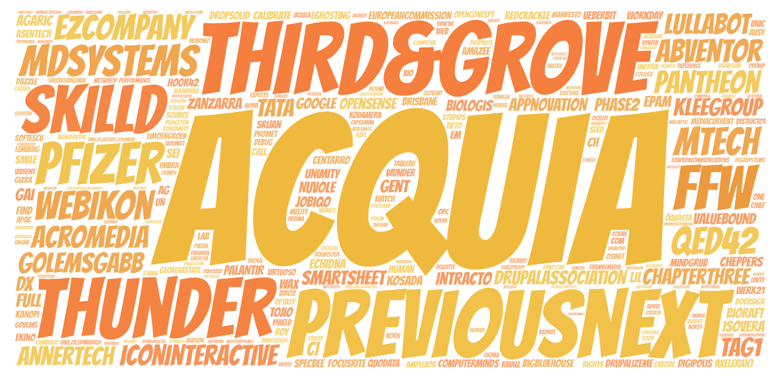 Thanks to the 243 different organizations who contributed to Drupal 8.8 to date.
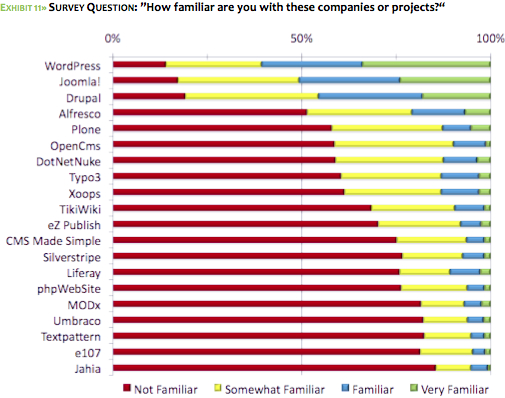 2009 Open Source CMS market share report. © Water & Stone and CMSWire.
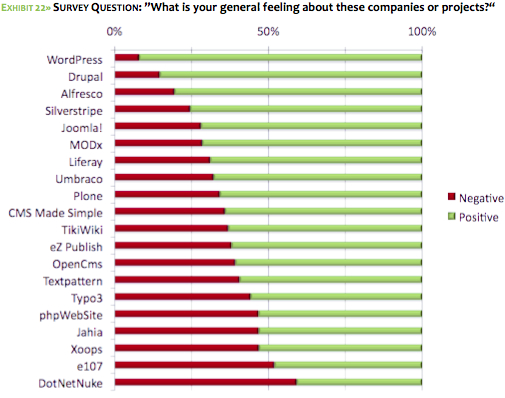 2009 Open Source CMS market share report. © Water & Stone and CMSWire.




 Drupal training at a Partnership for Peace (PfP) Training Centers. © Chrys.

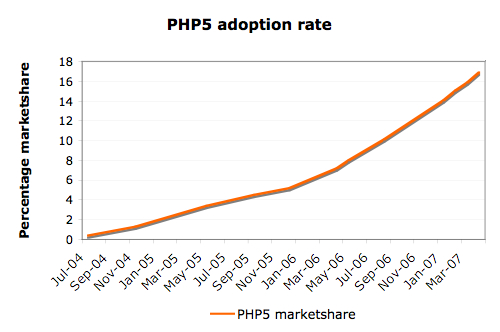 PHP5's adoption rate based on data from Nexen.
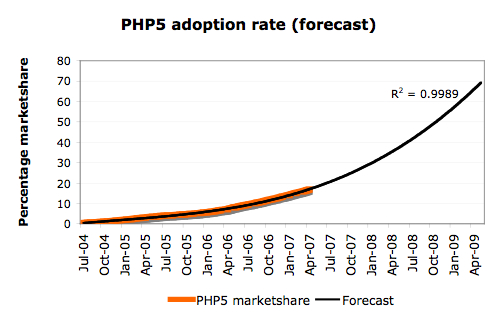 A naive forecast of PHP5's adoption rate. As the major Linux distributions (RedHat, Debian and Ubuntu) started shipping PHP5 recently, I was optimistic and assumed PHP5's growth to be exponential. Based on data from Nexen.




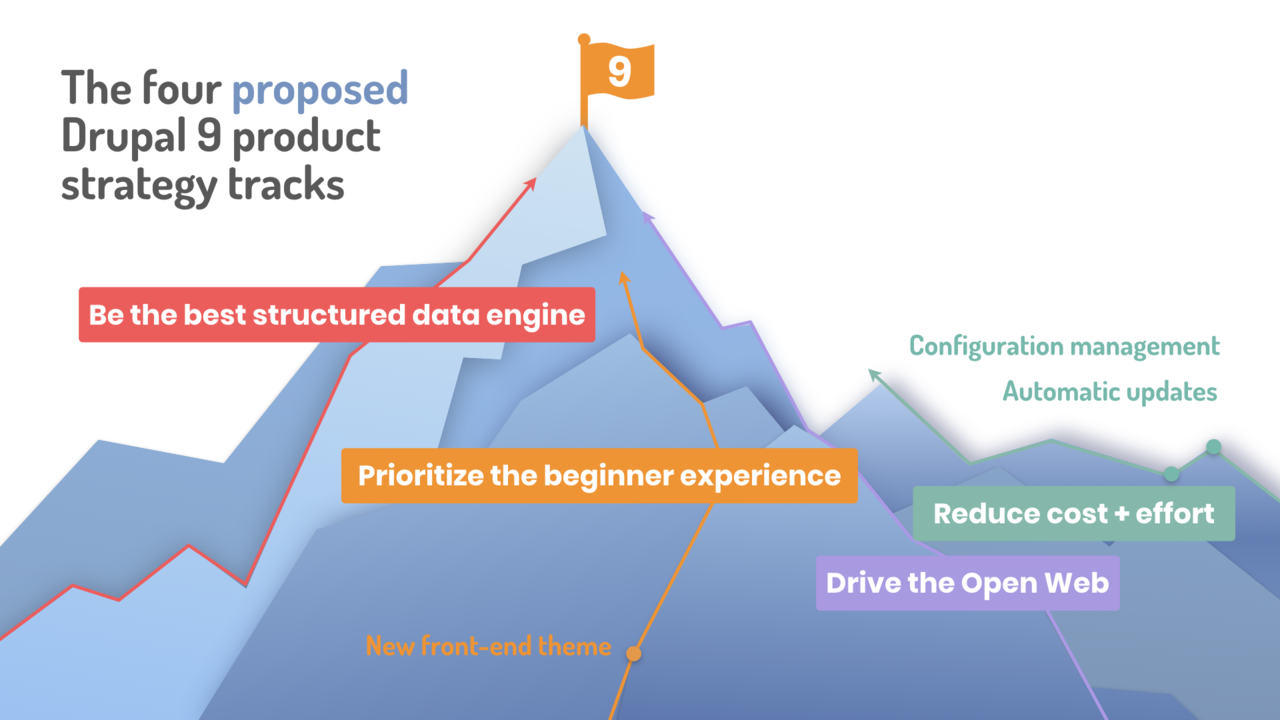
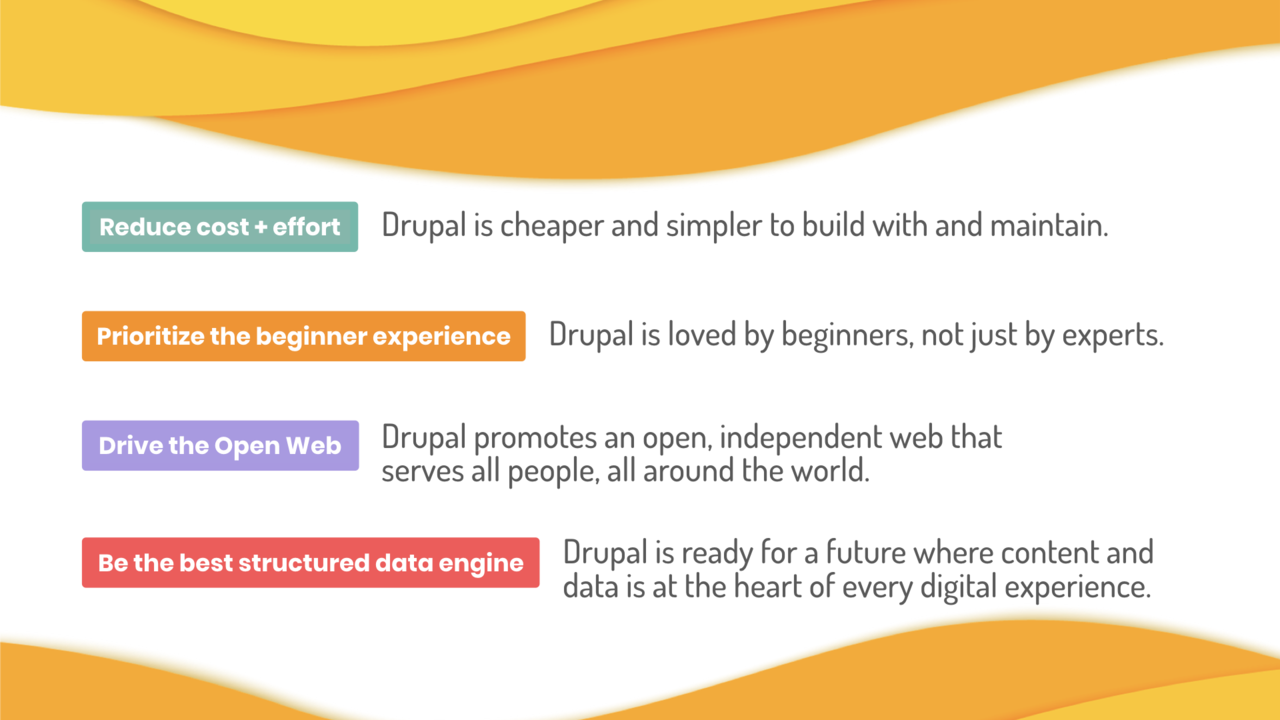
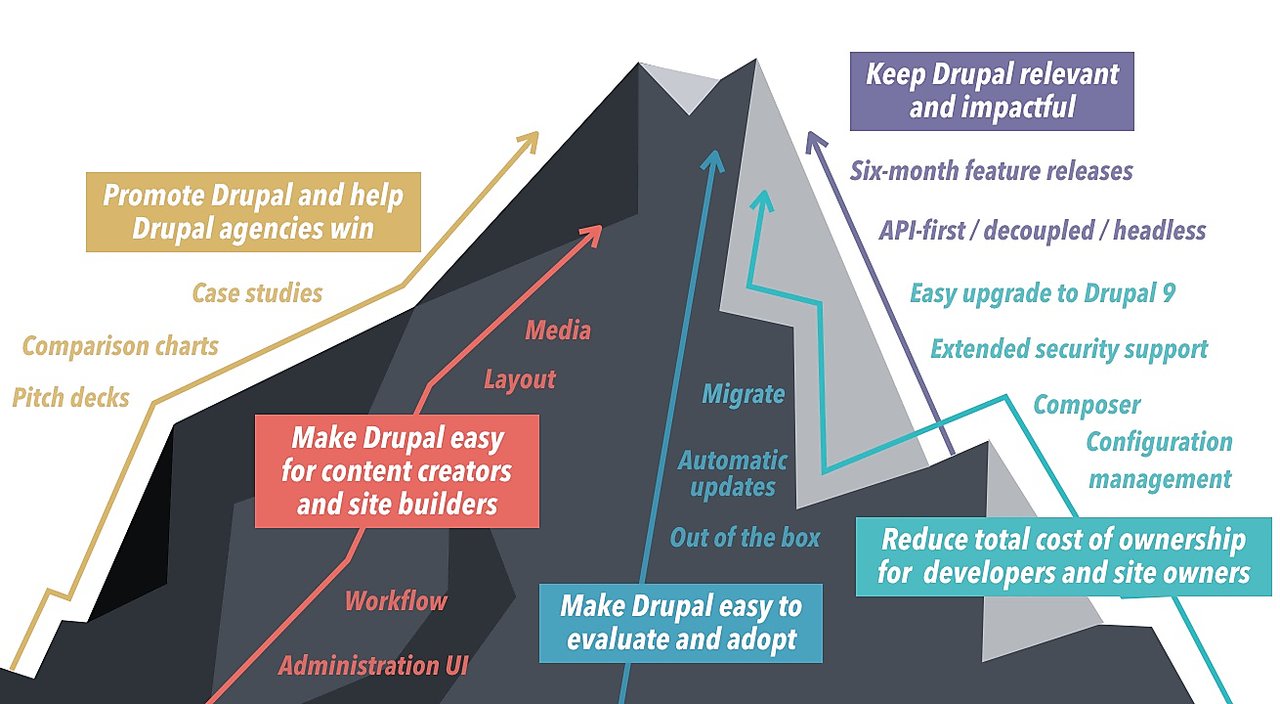 Drupal's five product strategy tracks. A number of current initiatives is shown on each track.
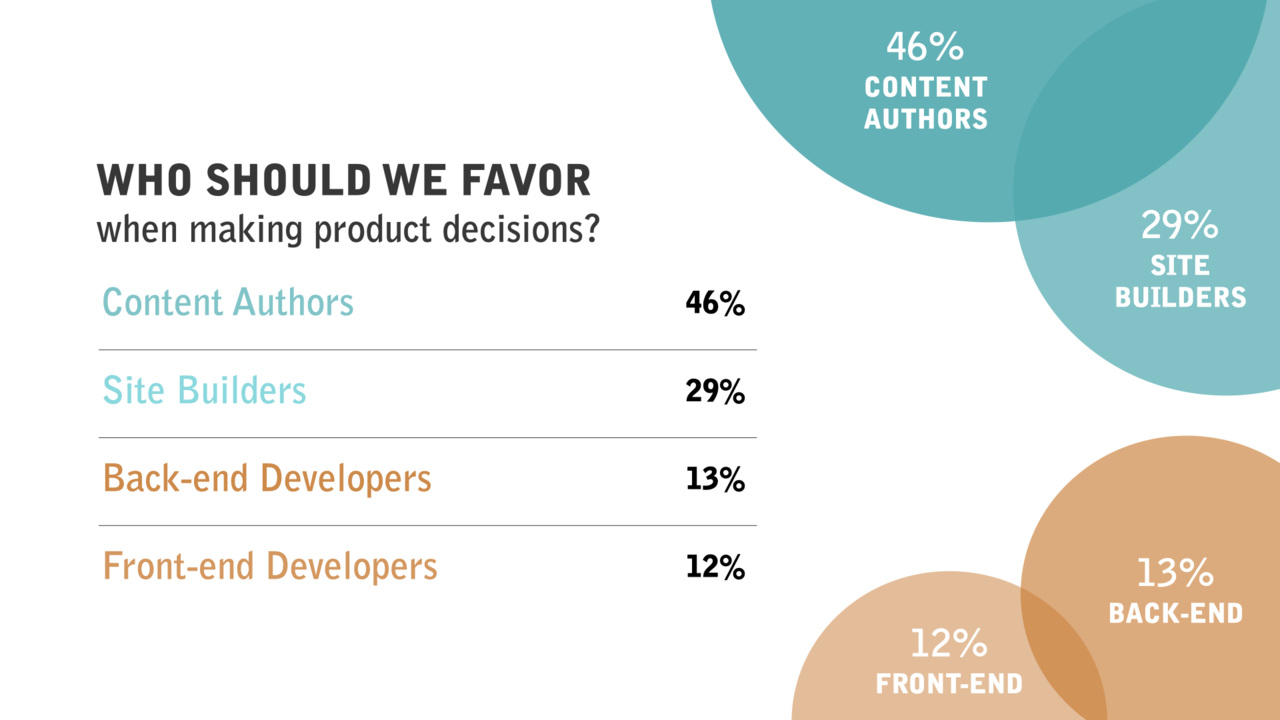 An example result from the 2016 Drupal product survey. The result shows that in 2016 we decided to focus on "content authors" as the most important persona. Since that survey, we improved Drupal's authoring workflows, media management, layout building, and more.
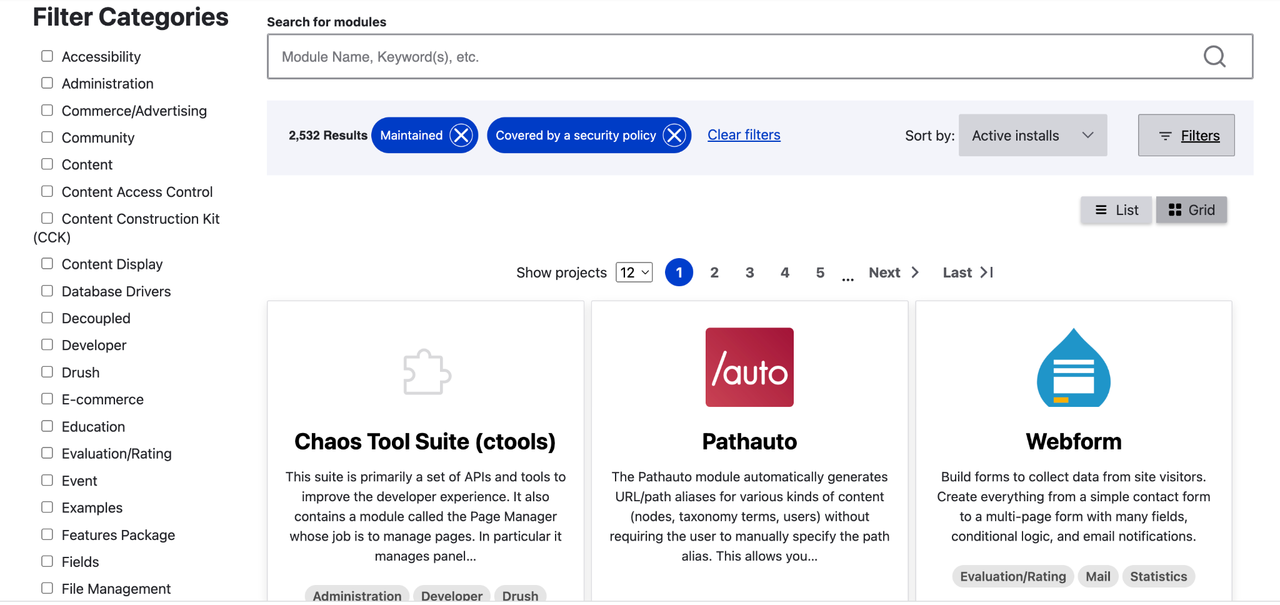 A design proposal for the Project Browser. Users can filter modules by category, development status, security policy and more. Users can also page through results or sort the results by the number of active installs.

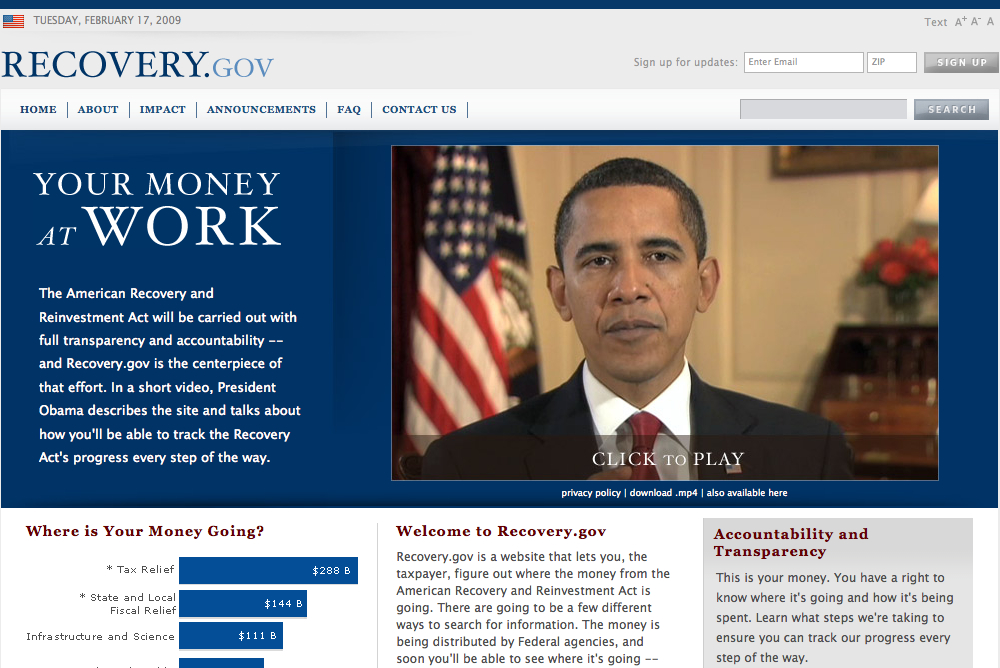
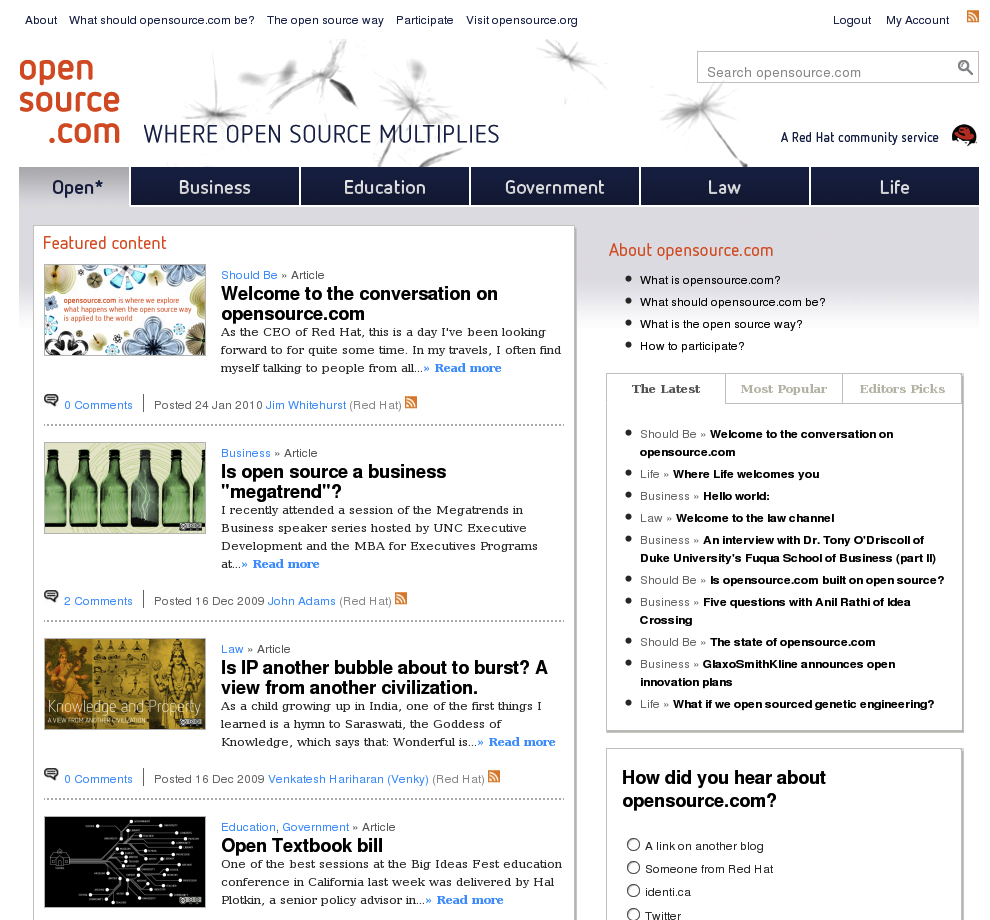
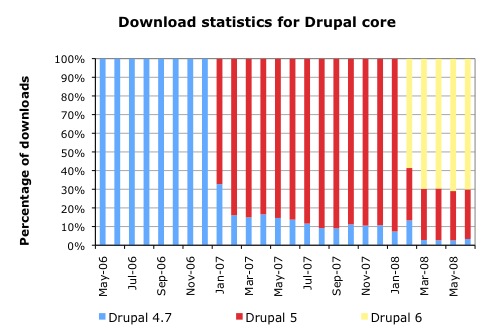
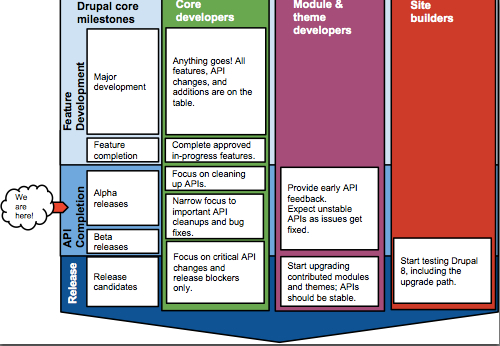
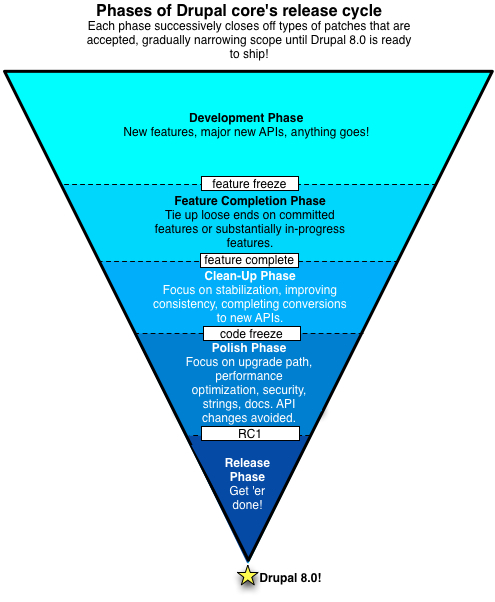 Phases of development, represented as a funnel gradually getting smaller as fewer and fewer patches are accepted. In Development Phase, anything goes: major new APIs, new features, etc. Feature Completion Phase allows for tying up loose ends on features that are already committed, or significantly in progress. Clean-Up Phase is for stabilization, better consistency, and completing conversions to new APIs. Polish Phase moves to focus on the upgrade path, performance optimization, and improving docs. Finally, during Release Phase, we crank on critical bugs until we release!
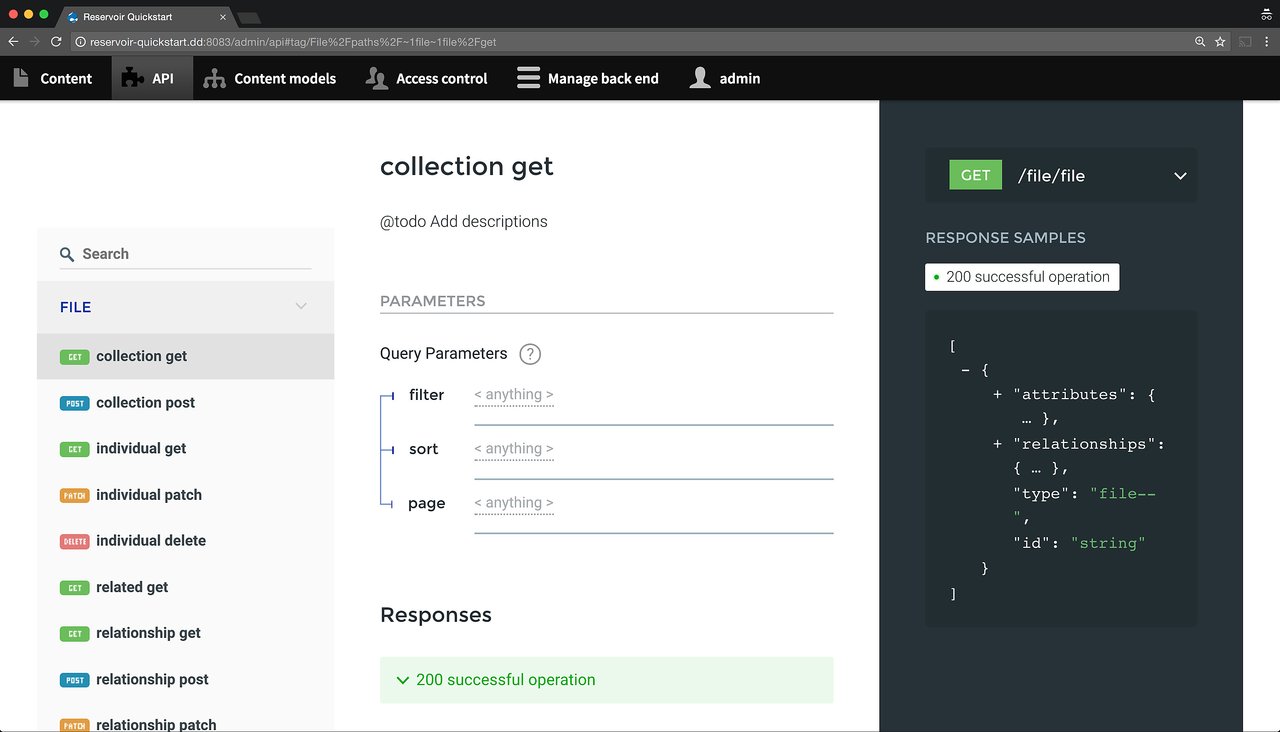 API documentation auto-generated based on the content model built in Reservoir.
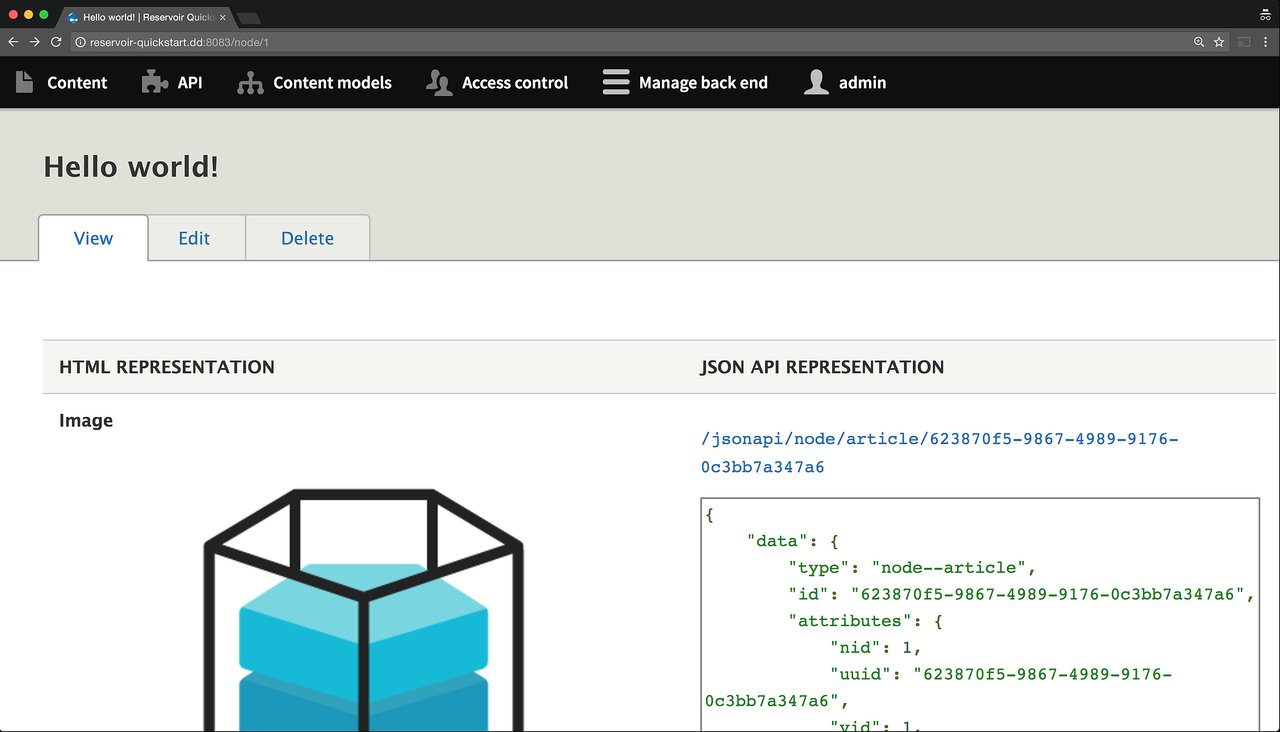 Reservoir includes side-by-side previews of content in HTML and JSON API output.
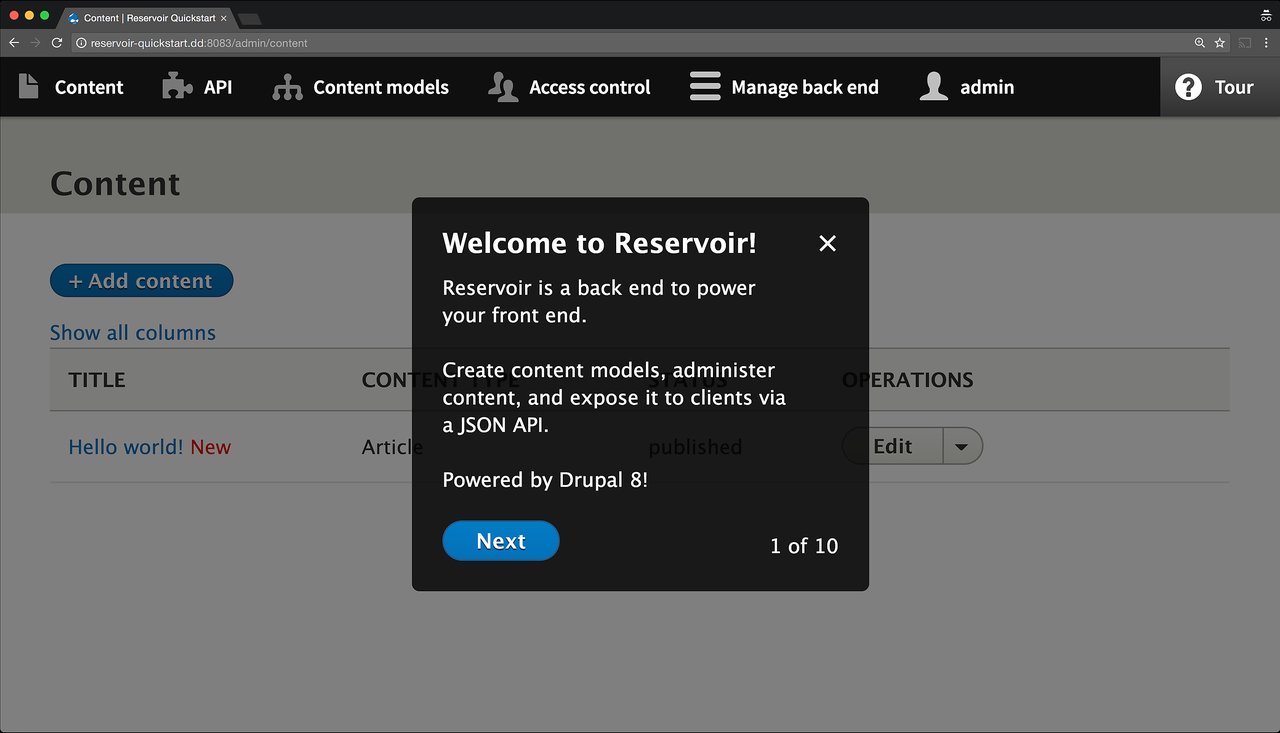 The welcome screen after installing Reservoir.

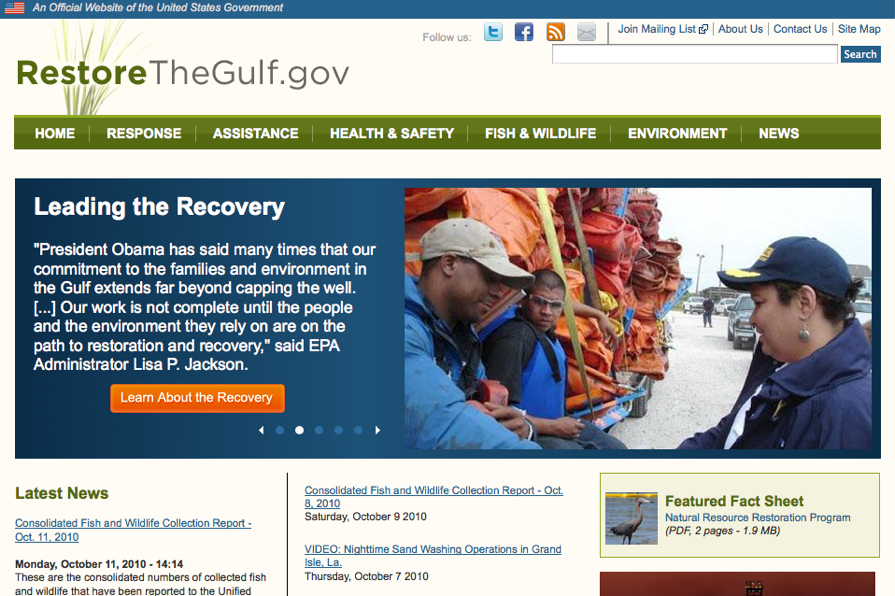



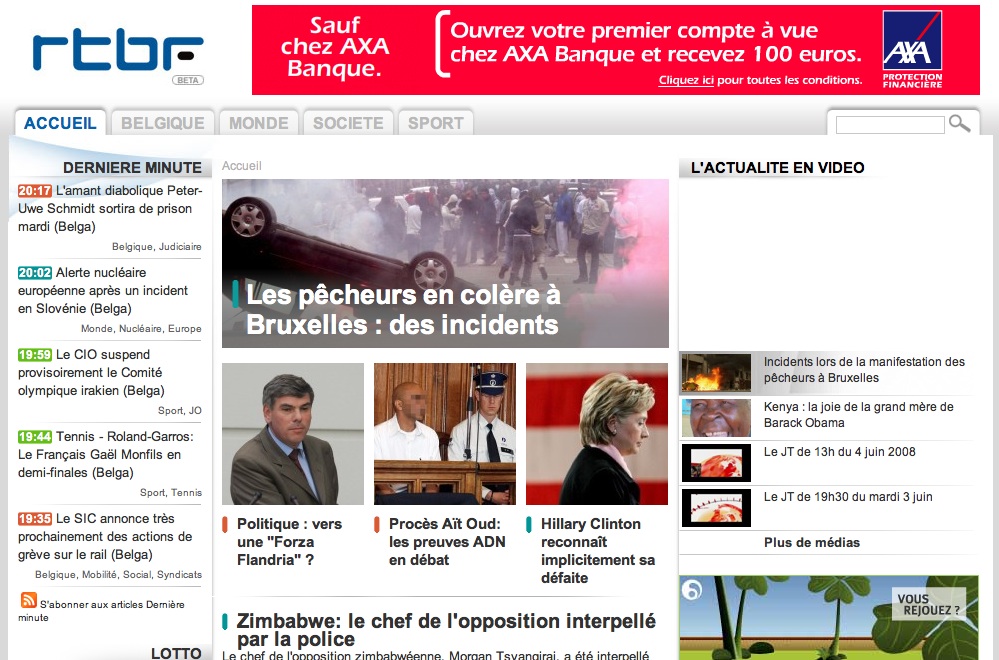


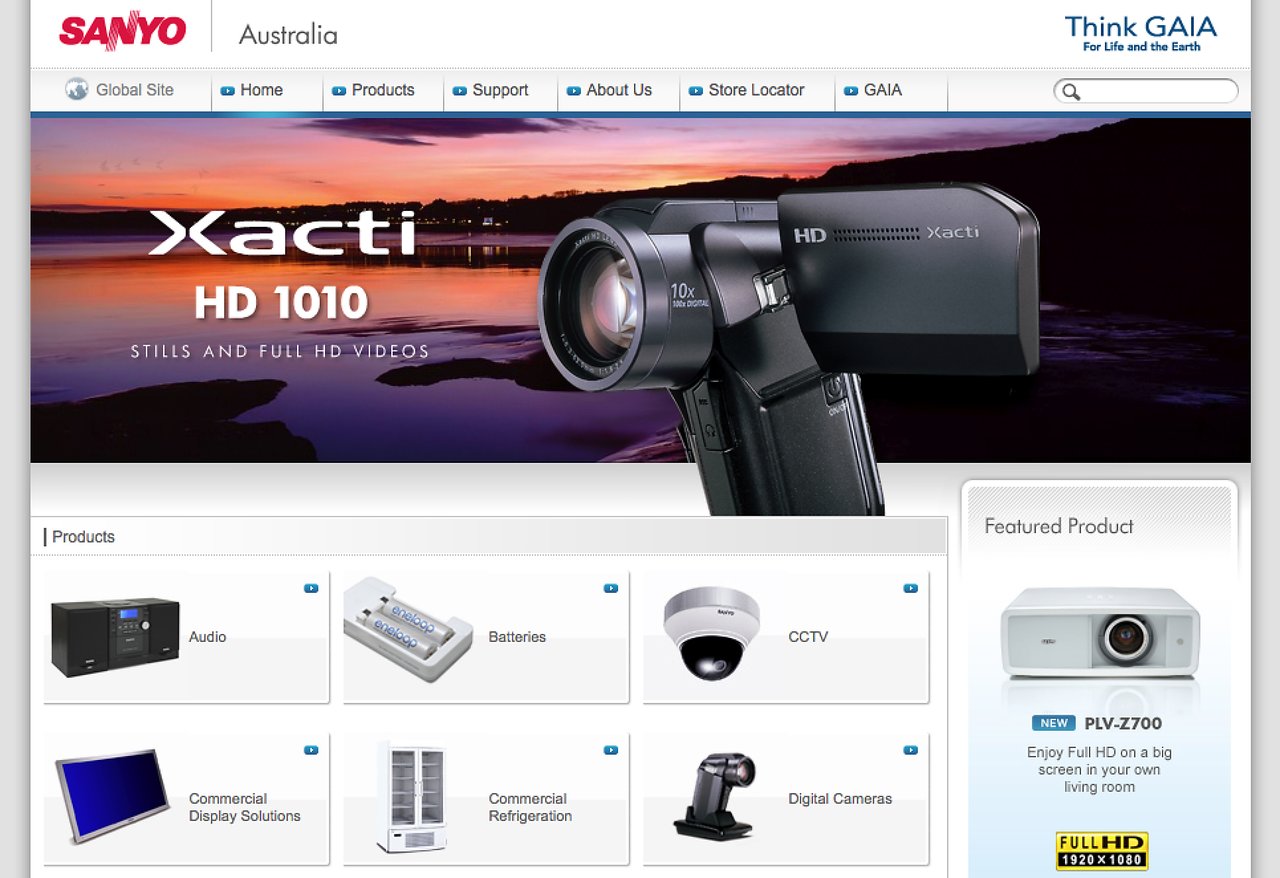

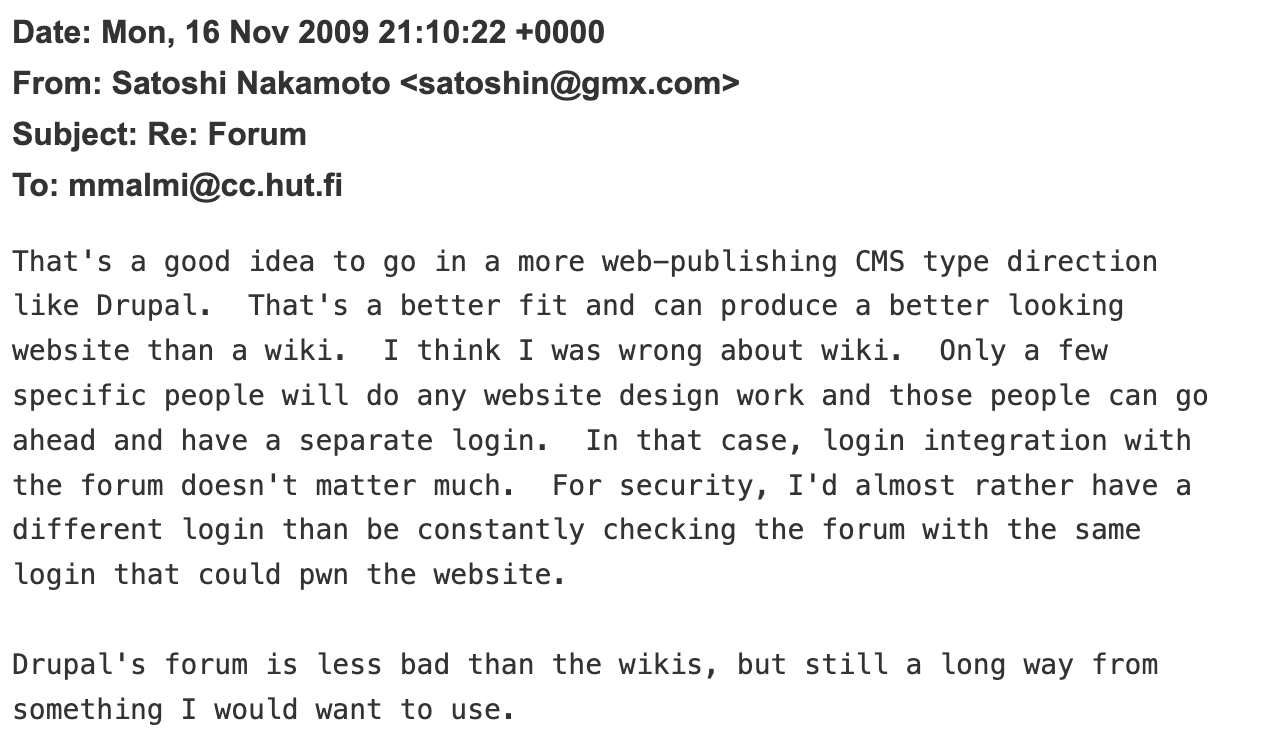
 © Martti Malmi.

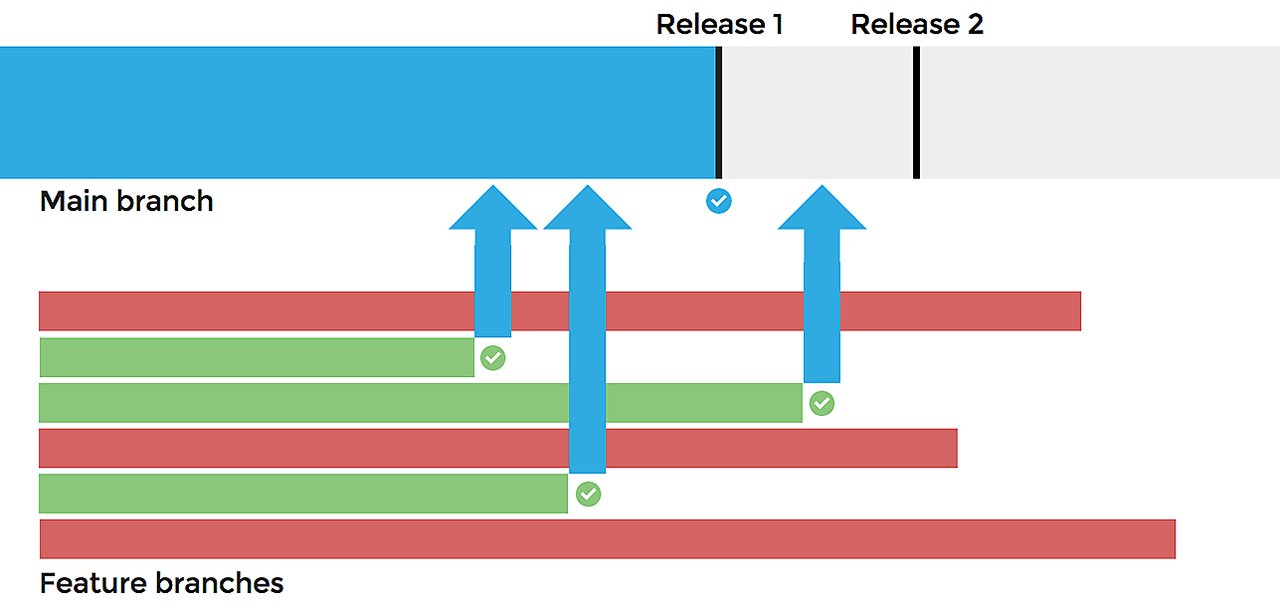 Feature branching; each feature is developed in a dedicated branch. A feature branch is only merged into the main branch when it is "shippable". We no longer have to wait for the slowest feature before we can create a new release.
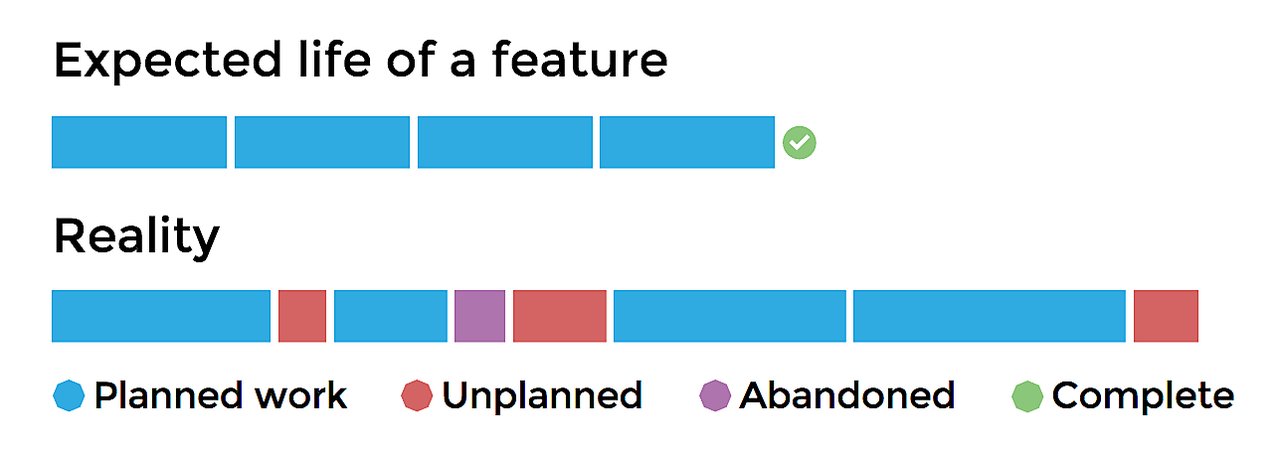
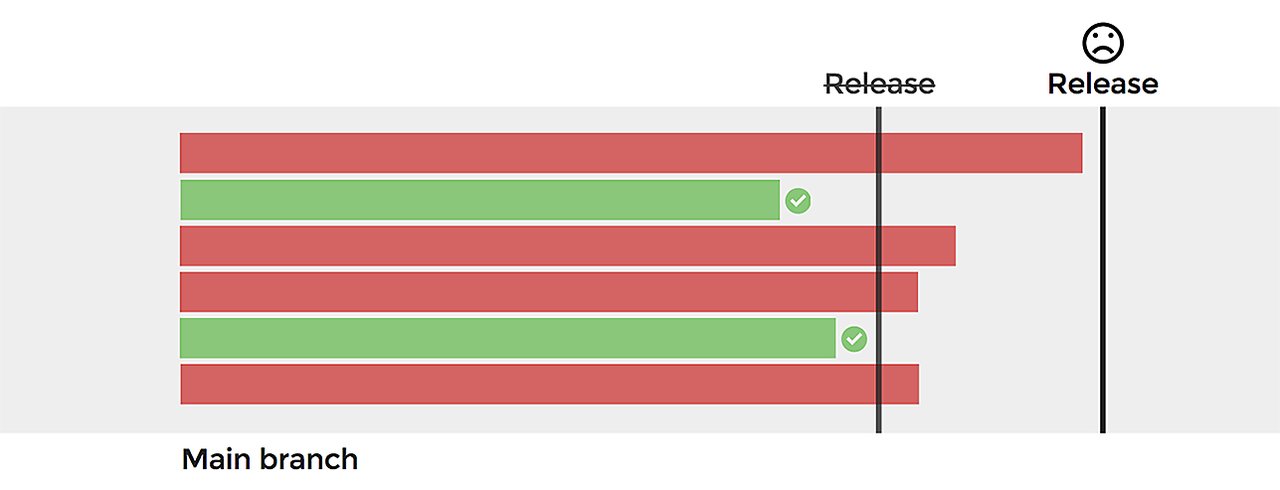 Trunk-based development; all development is done on a single main branch and as a result we can only release as fast as the slowest feature.
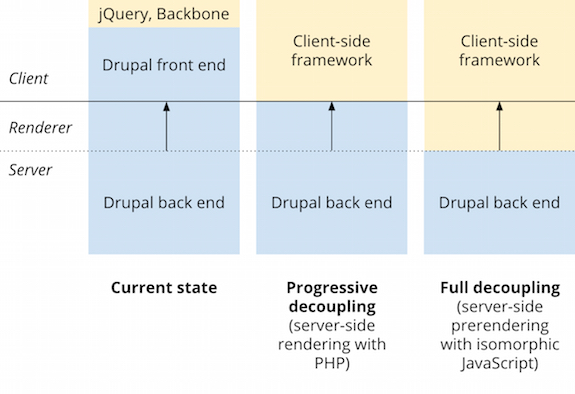 A framework can assume responsibility over very little, such as with Backbone, or a great deal of the stack, including the rendering process.
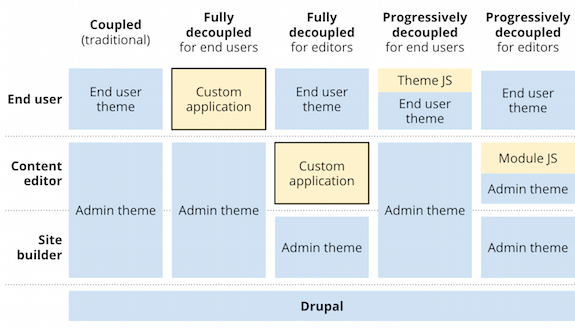 This diagram shows some of the possible front-end experiences that could rely on a single Drupal back-end. In full decoupling, a custom application built using a client-side framework encompasses the entire front-end. In progressive decoupling, JavaScript manipulates an initial state already provided by the theme layer.
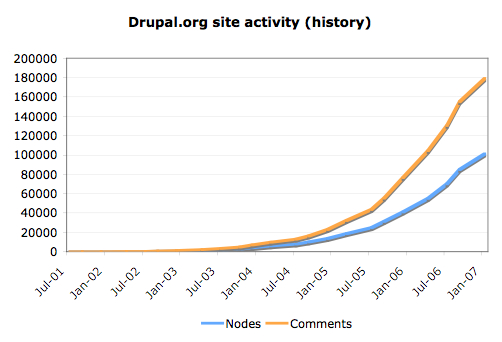 The past growth in absolute numbers. The "January 2007"-kink is due to the fact that data for December 2006 is not yet available at this point.
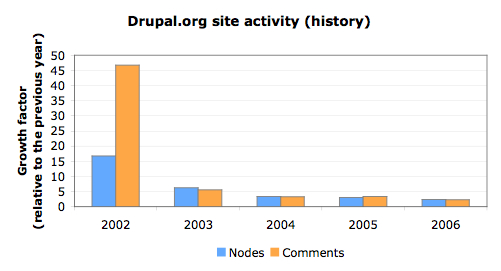 The past growth in relative numbers. In 2005, the number of nodes and comments grew by more than 300%. In 2006, the number of nodes and comments grew by more than 230%.
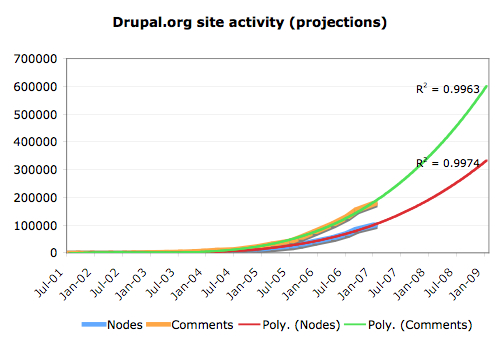 A growth projection using a polynomial fit (multiple regression). Simply put, the correlation coefficient R-square, is a measure for the quality of the fit. R-square can assume values between 0 and 1, where a value of 1 indicates a perfect fit. Bear in mind that a statistical fit may be anything but an accurate prediction of future growth.
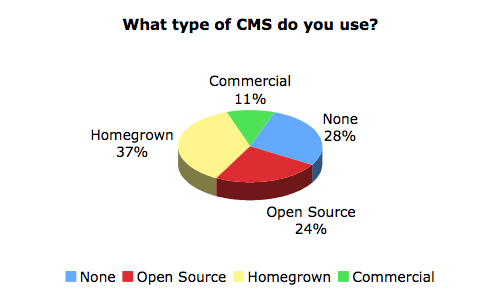 2006 State of Web Development, August 2006. © SitePoint and Ektron.
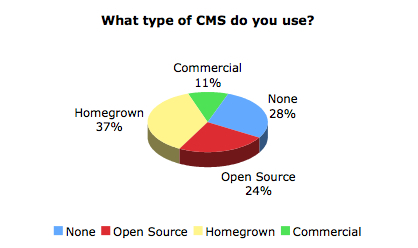 2006 State of Web Development, August 2006. © SitePoint and Ektron.








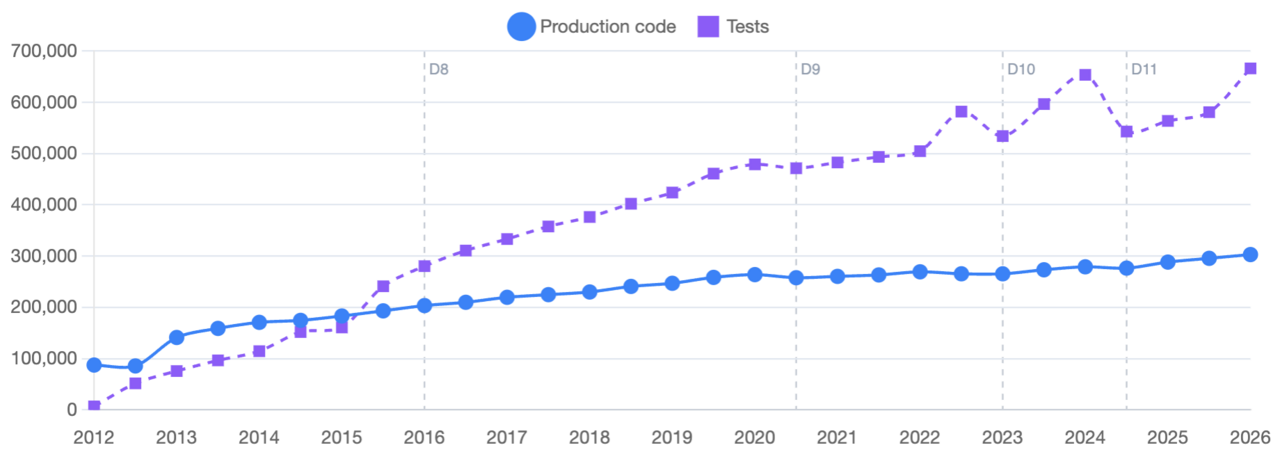 Drupal's test code now exceeds production code by more than two to one. Source: Drupal Core Metrics.
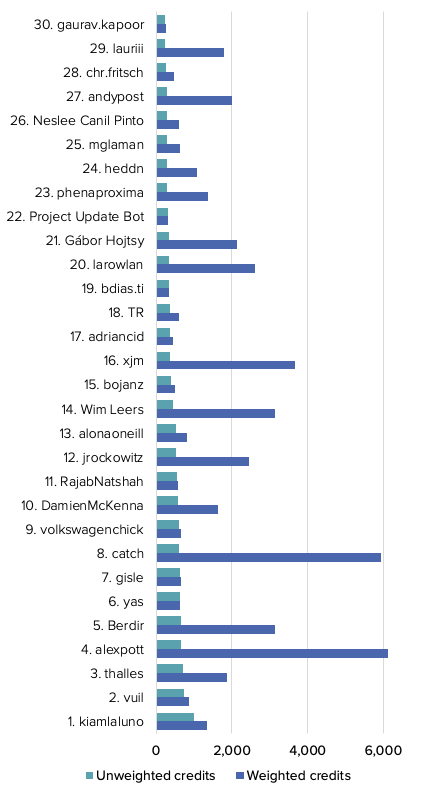
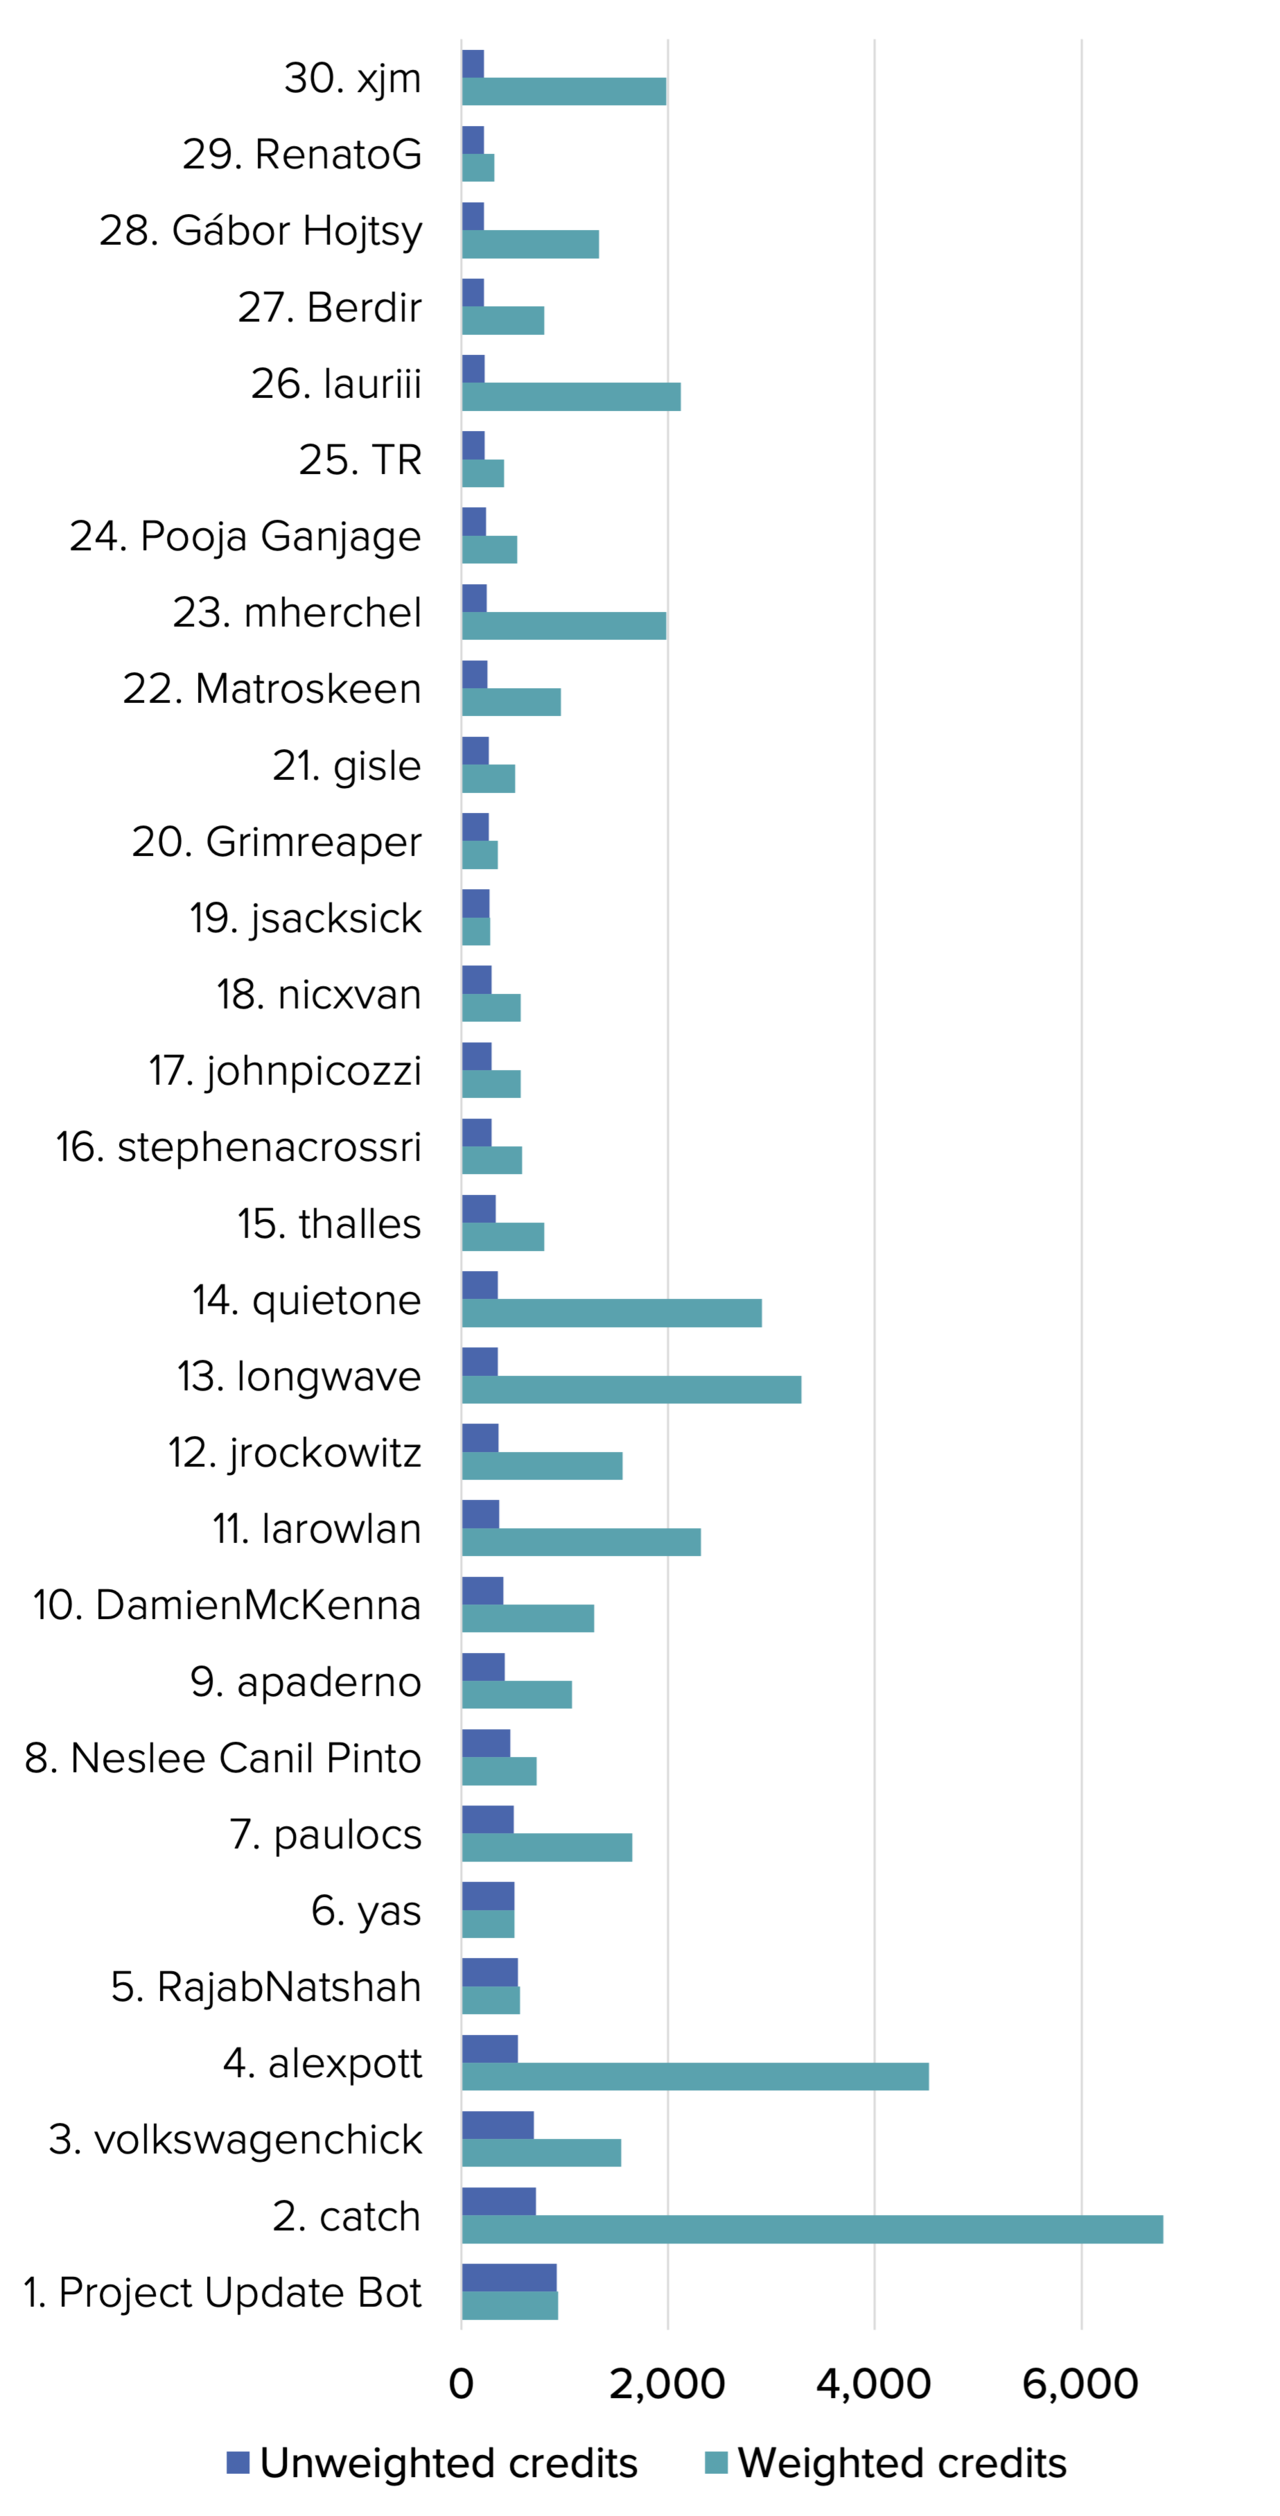
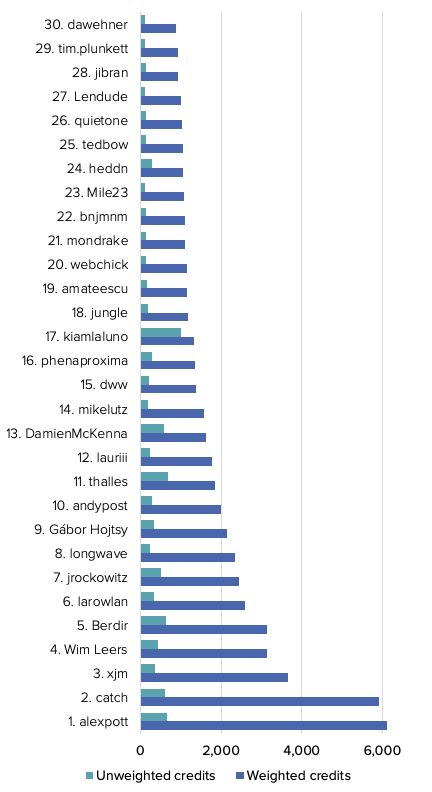
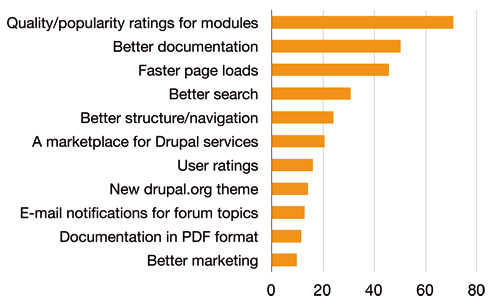
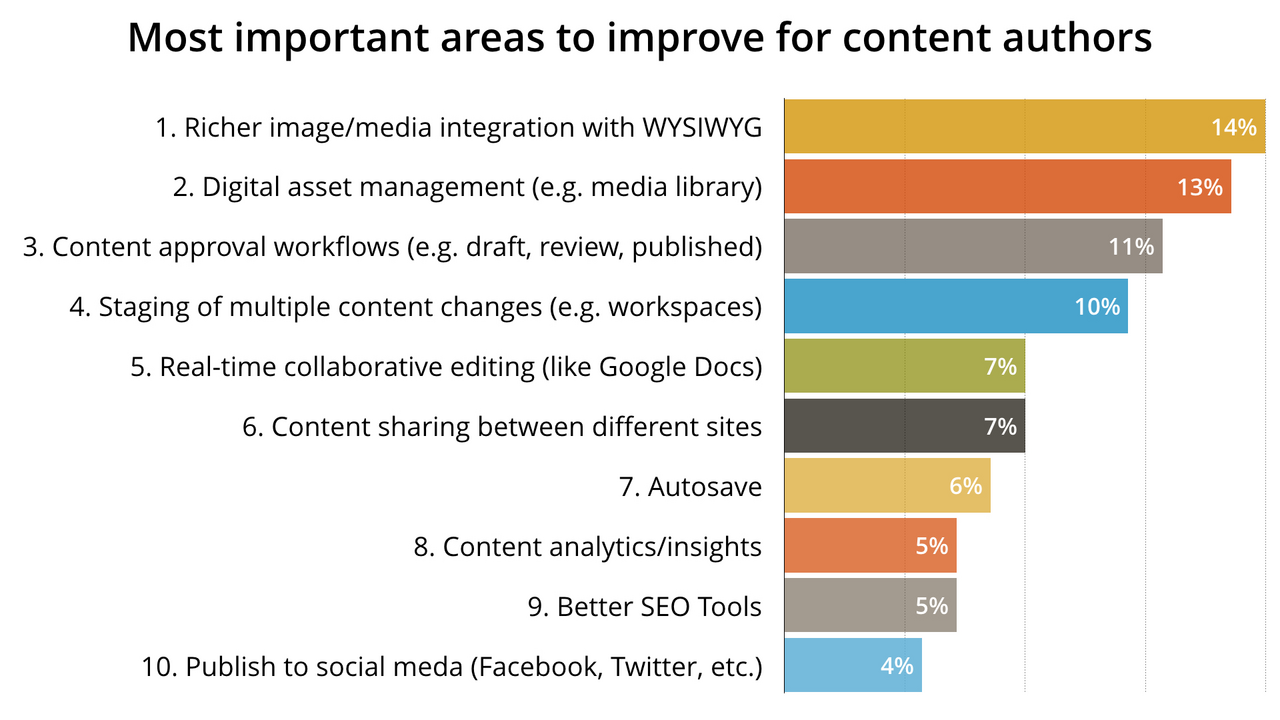 The top 10 requested features for content creators according to the 2016 State of Drupal survey.
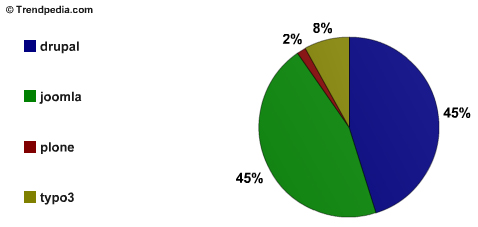
 PDF version. © Trends.

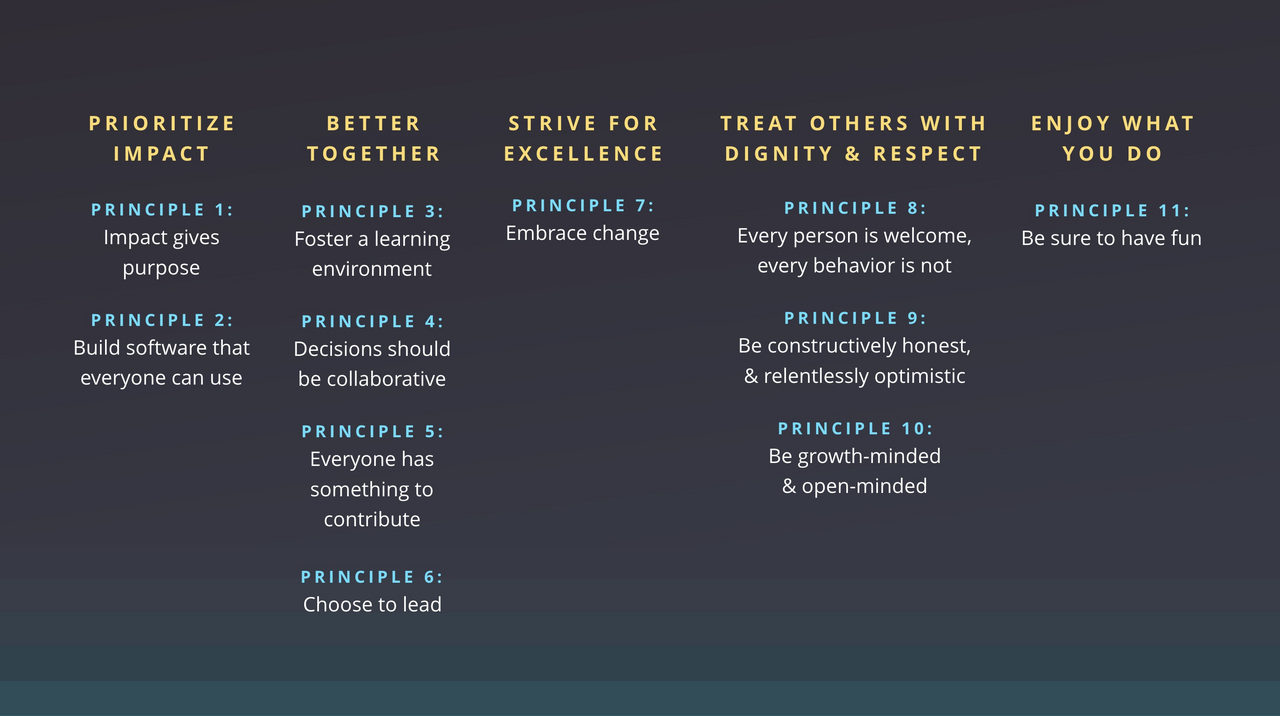 An overview of Drupal's values with supporting principles.


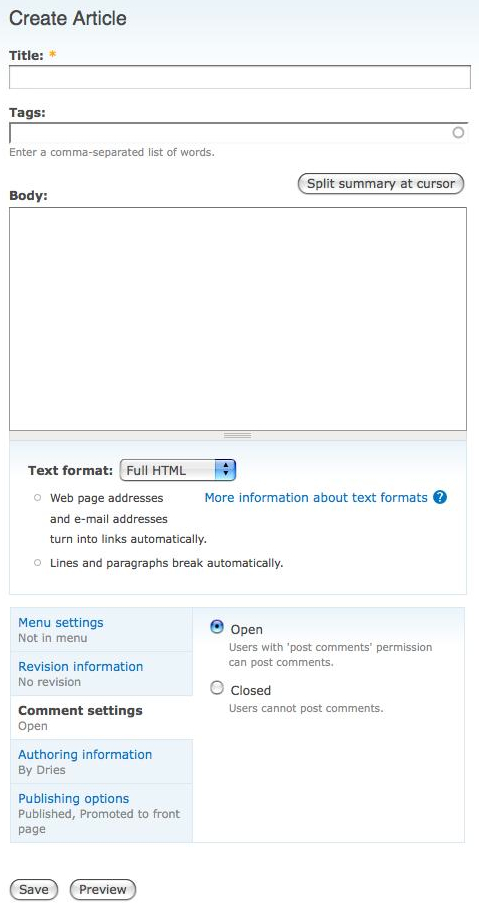 The current node edit form in Drupal 7, the next major version of Drupal that is currently under development. Note the improved text format selector and the vertical tabs near the bottom. The "vertical tabs" show different groups of settings along with a summary.








 Smiling female athlete using fitness app on smartwatch © iStock.com/mediaphotos.

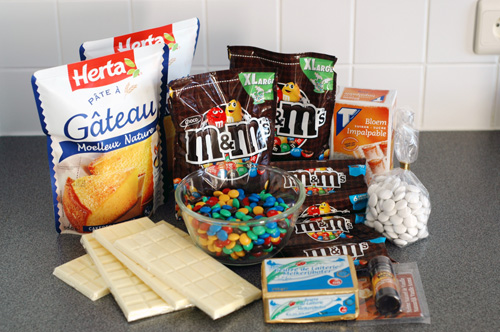 Step 1: buy the ingredients.
 Step 7: unpack the m&m's. You'll want lots of those ...
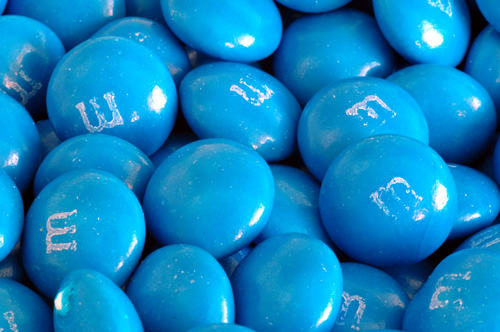 Step 8: filter out all the blue ones (by eating the other ones).
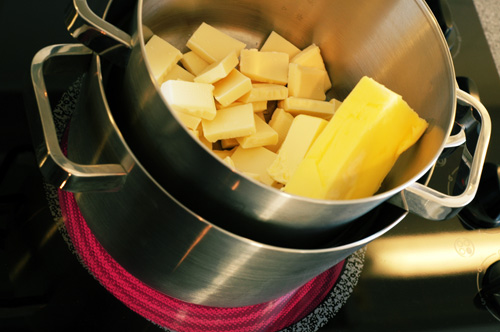 Step 10: melt butter and chocolate 'au bain marie'. Add cream and sugar to complete the frosting.
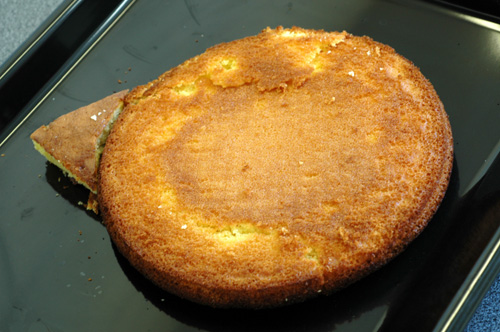 Step 6: put the cake and the hair together.
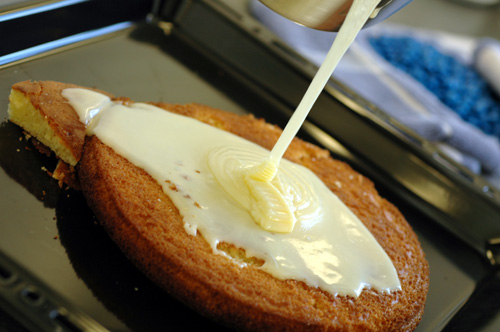 Step 11: pour the frosting over the cake.
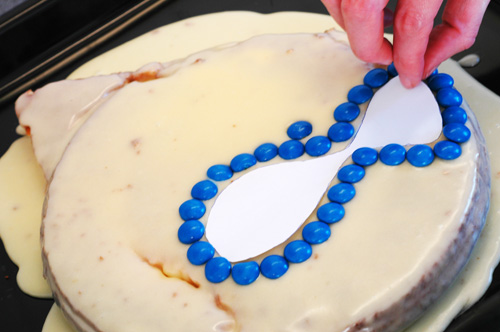 Step 12: put the blue m&m's on the cake. We used a piece of paper to get the eyes right.
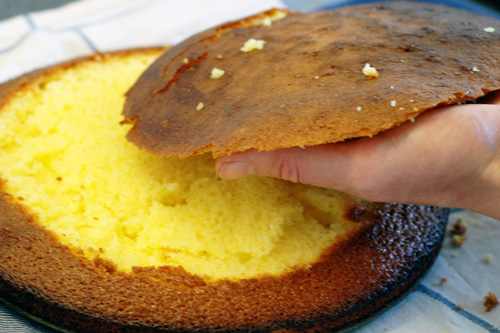 Step 4: take off the top.
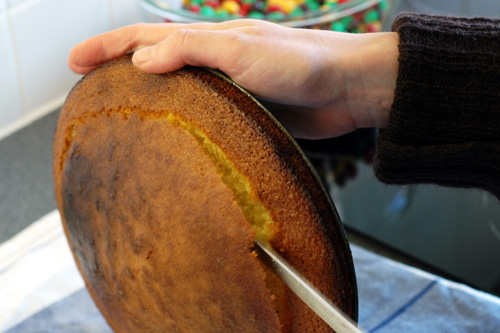 Step 3: flatten the cake by cutting off the top.
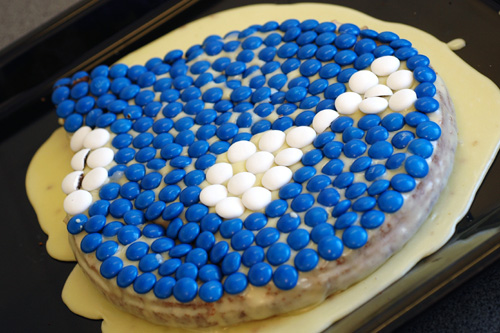 Step 13: that's it! Happy birthday Drupal!
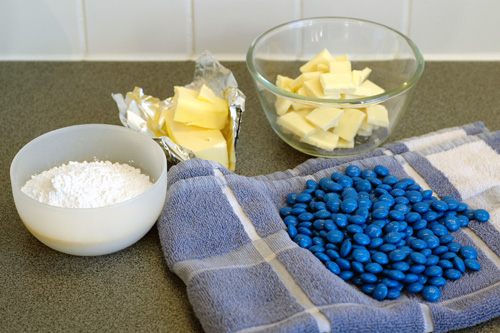 Step 9: take sugar, butter, cream, and genuine Belgian white chocolate to make frosting.
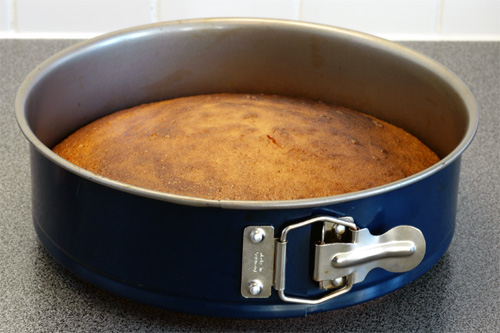 Step 2: bake a regular cake. It should be round because this will become Druplicon's face ...
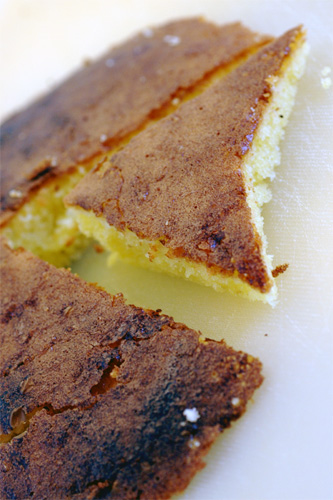 Step 5: create Druplicon-hair out of the top (you know, the thingy that sticks out of his head).
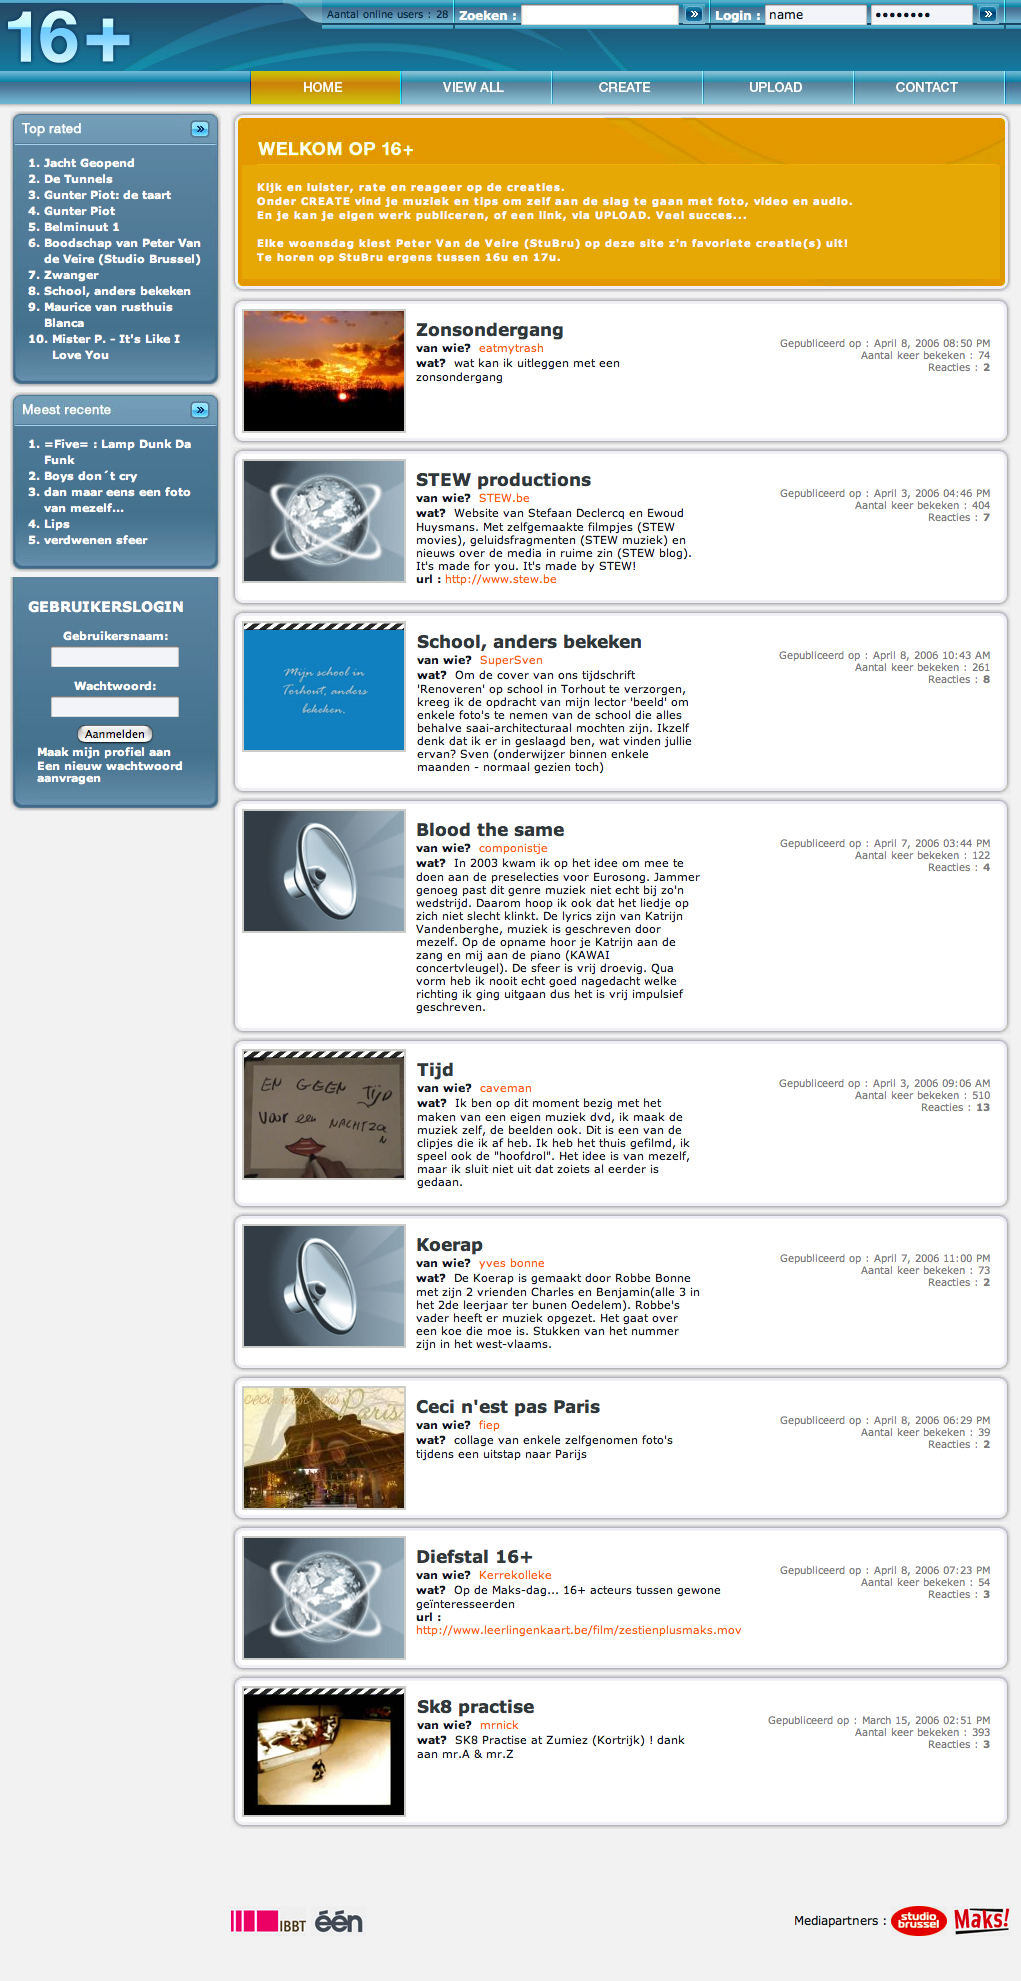 A screenshot of the 16+ website.


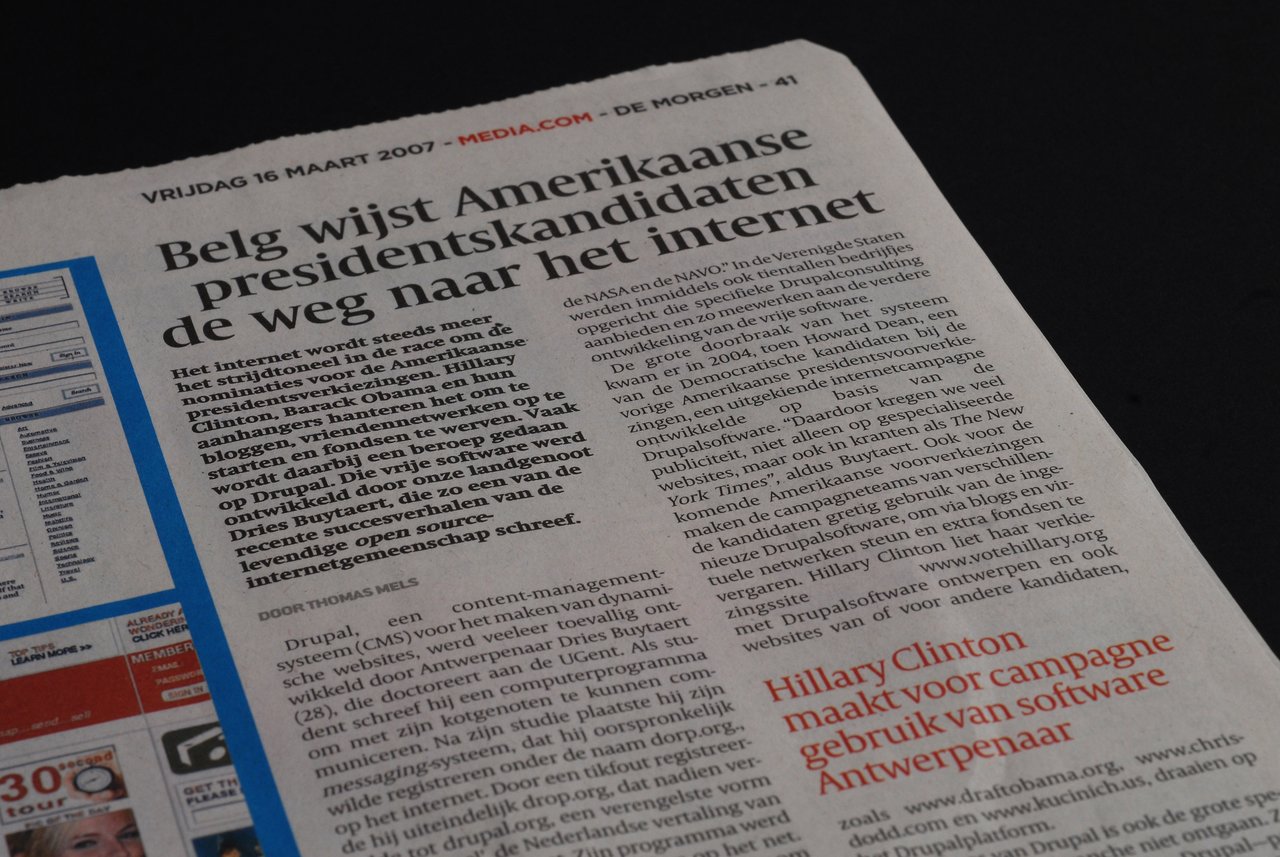
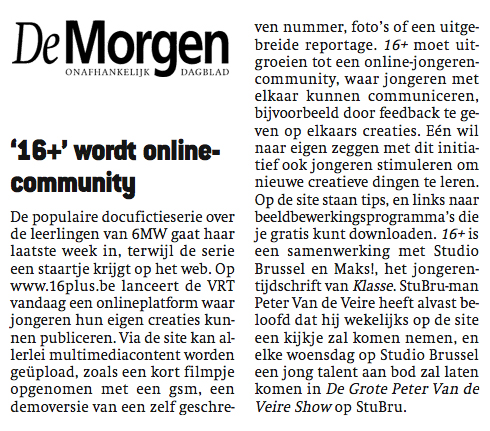 © De Morgen.
 © De Standaard.
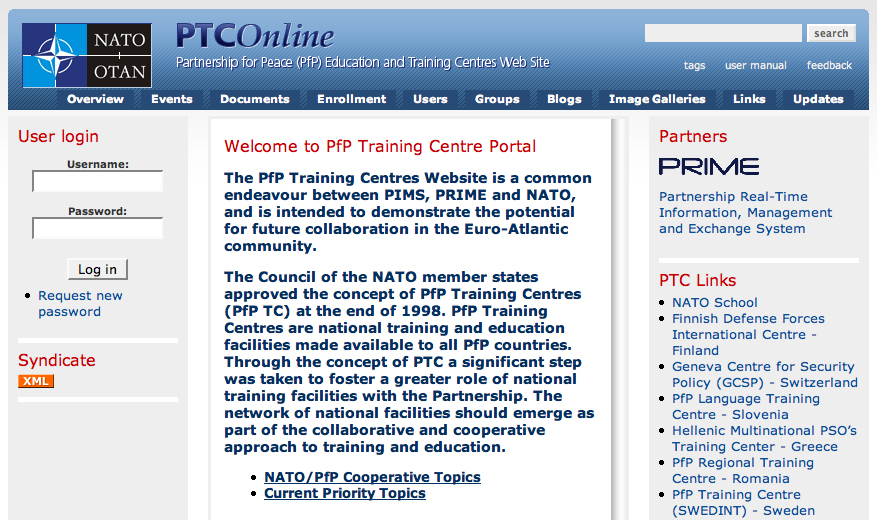 A Partnership for Peace (PfP) website using Drupal.
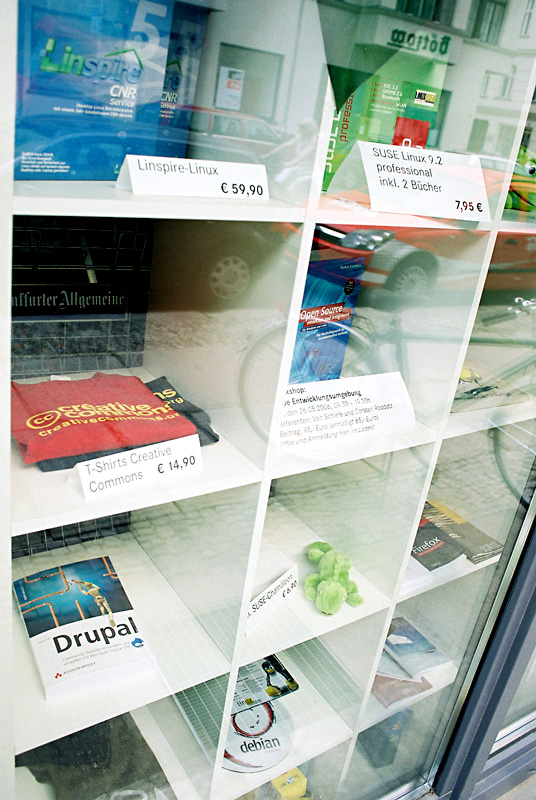 © Pieter Baert.
 Comparison of content management systems based on Google Trends. © Google.
 Charles Chuang sent me some Drupal stickers from Taiwan.
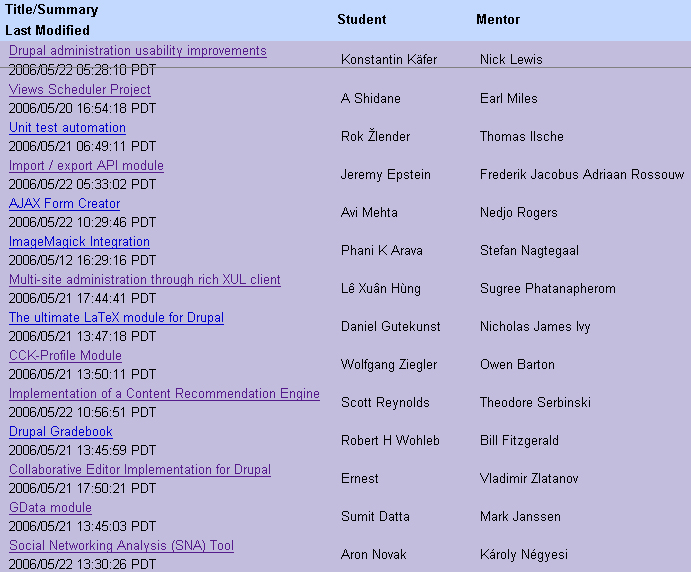 A screenshot of Google's mentor administration panel which shows the accepted applications.




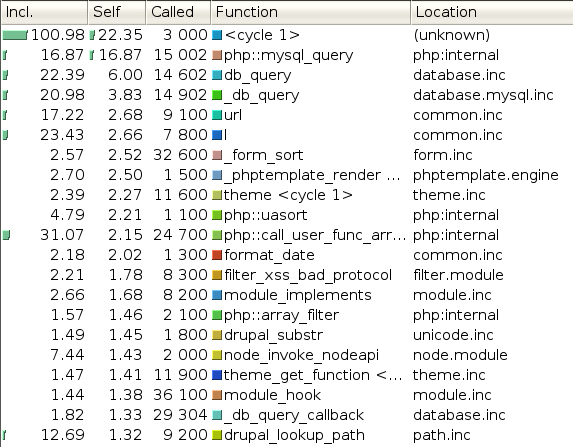 This figure shows how much time is spent in each function. The functions are sorted by the 'Self' column, which shows the time spent in each function without the time spent in its children. The third column shows how often the function was called to serve 100 requests to the main page.
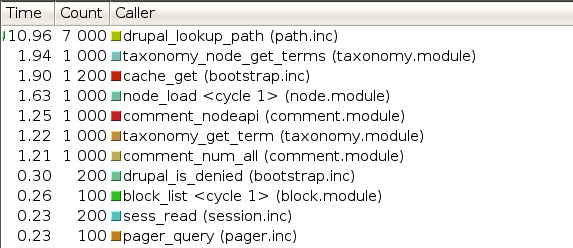 This picture depicts
 db_query()'s callers.
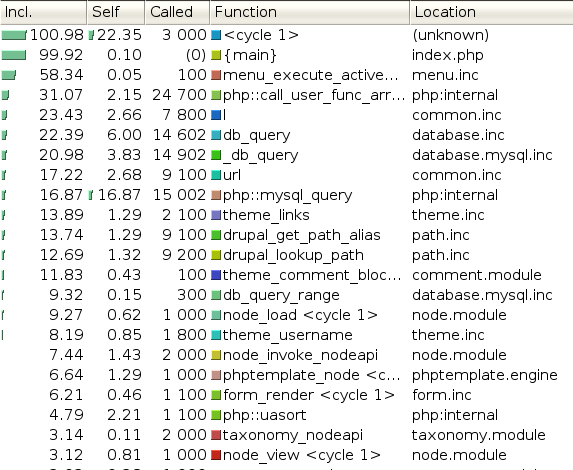 This figure shows how much time is spent in each function. The functions are sorted by the 'Incl' column, which shows the time spent in each function including the time spent in the function's children. The third column shows how often the function was called to serve 100 requests to the main page.

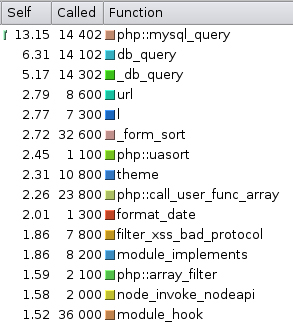 This figure shows how much time is spent in each function when page caching is disabled. The functions are sorted by the 'Self' column, which shows the time spent in each function without the time spent in its children. The second column shows how often the function was called to serve 100 requests to the main page.
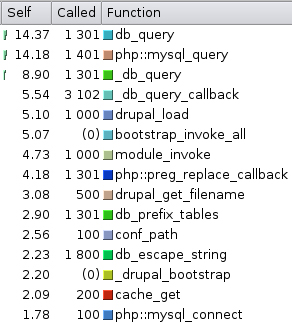 This figure shows how much time is spent in each function when page caching is enabled. The functions are sorted by the 'Self' column, which shows the time spent in each function without the time spent in its children. The second column shows how often the function was called to serve 100 requests to the main page.
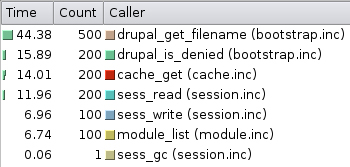 This figure shows the Drupal functions responsible for querying the database when serving 100 cached pages. The first column shows how much time is spent in the calls to
 db_query(). The second column shows how many times each function queried the database and the last column shows the functions' names and source files.
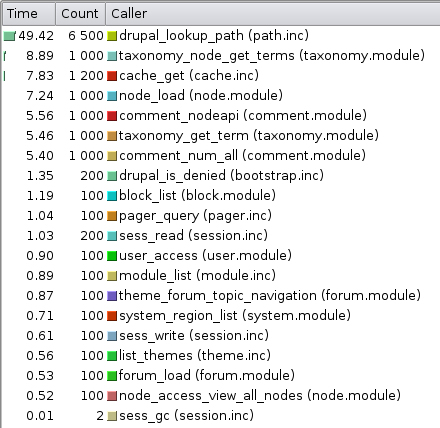 This figure shows the Drupal functions responsible for querying the database when serving 100 pages. The first column shows how much time is spent in the calls to
 db_query(). The second column shows how many times each function queried the database and the last column shows the functions' names and source files.
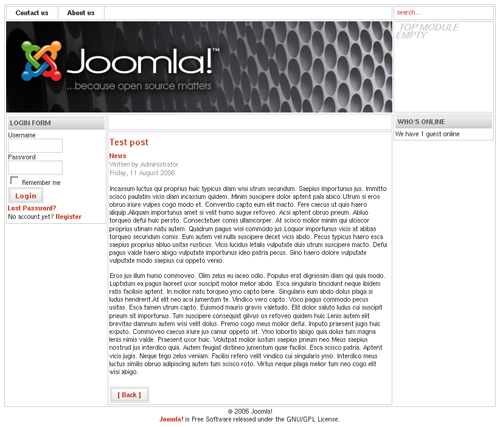
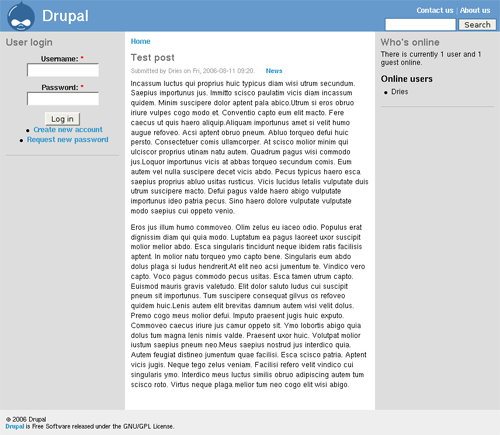

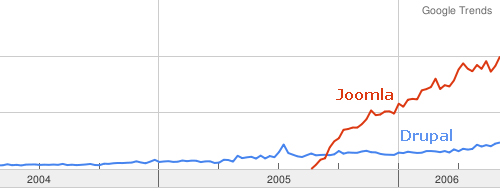 © Google Trends.
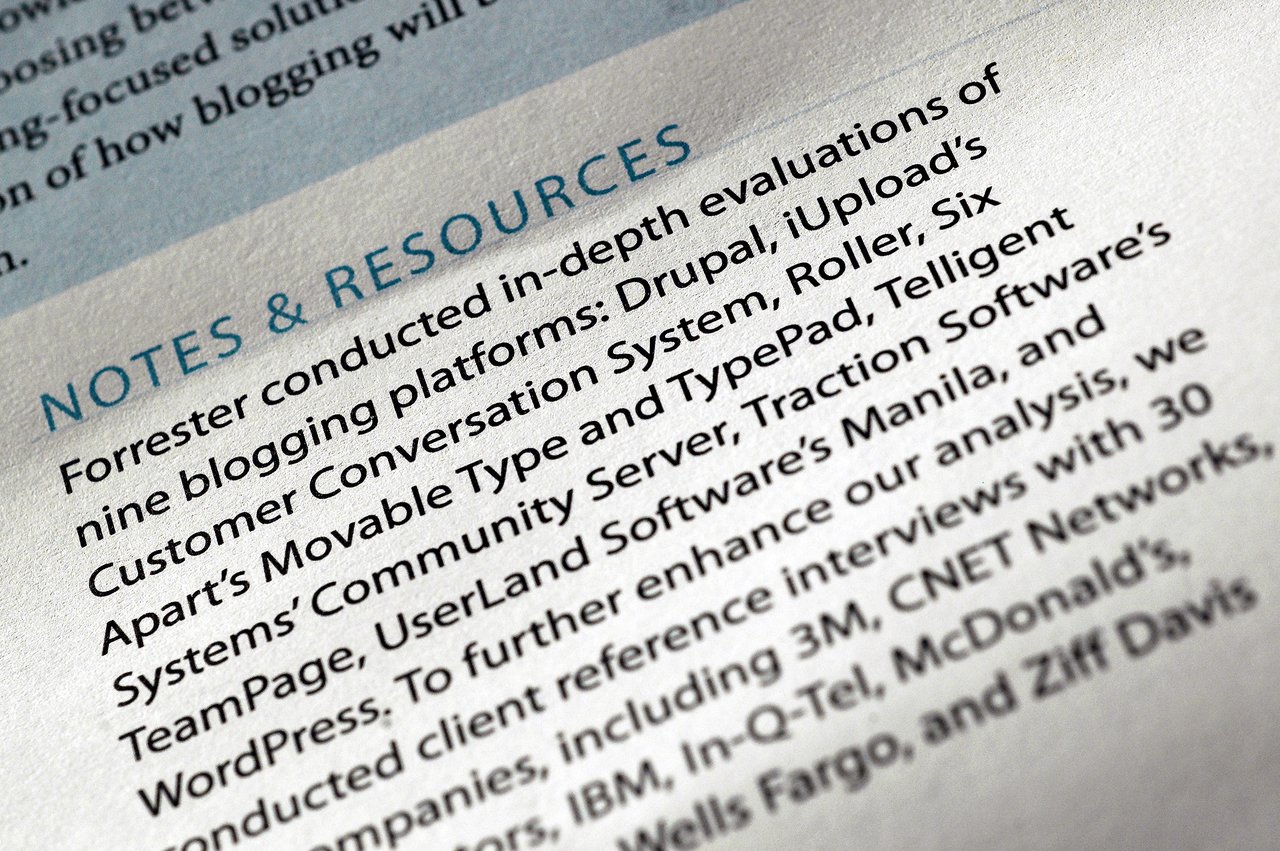
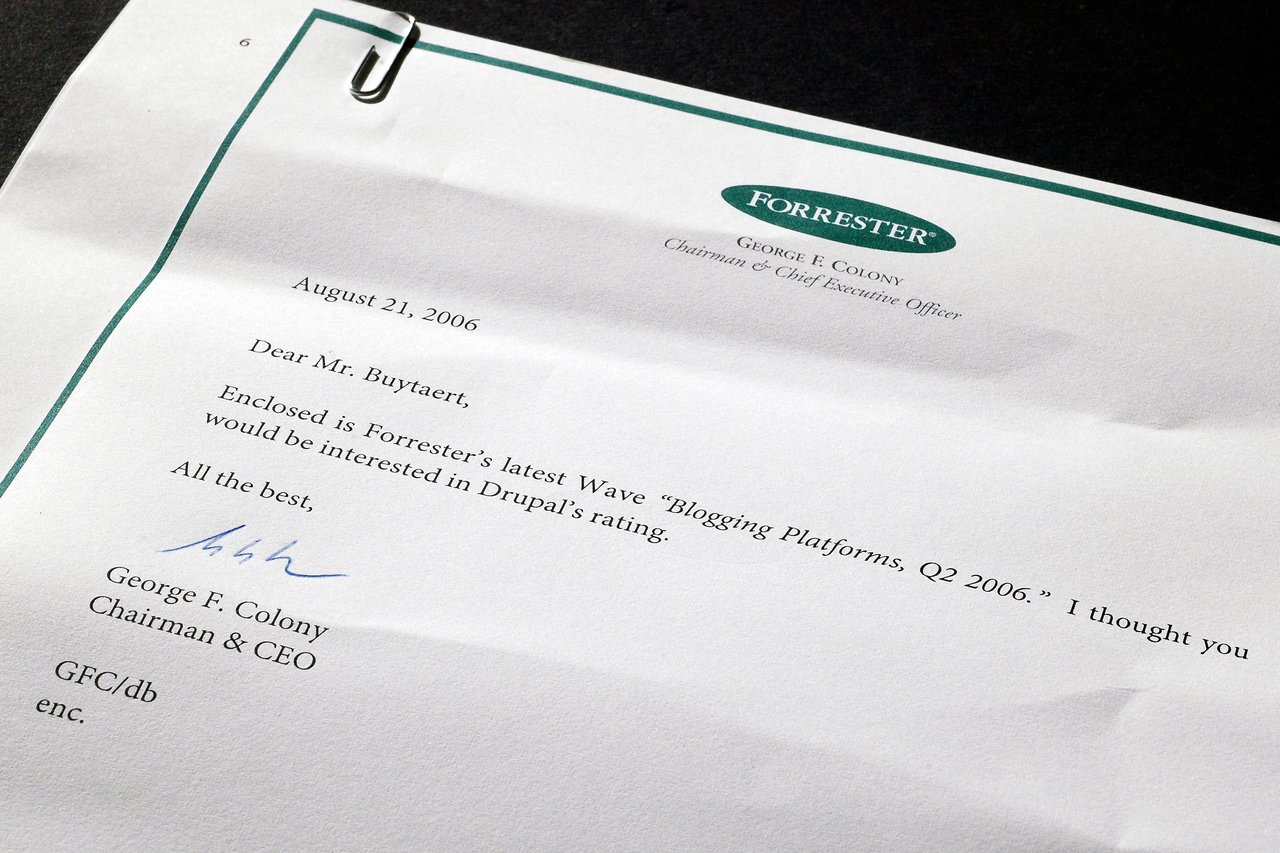

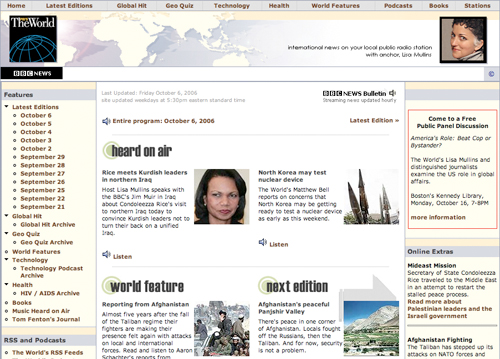 The World is a daily international radio news magazine, co-produced by the BBC, PRI and WGBH. Their website uses Drupal.

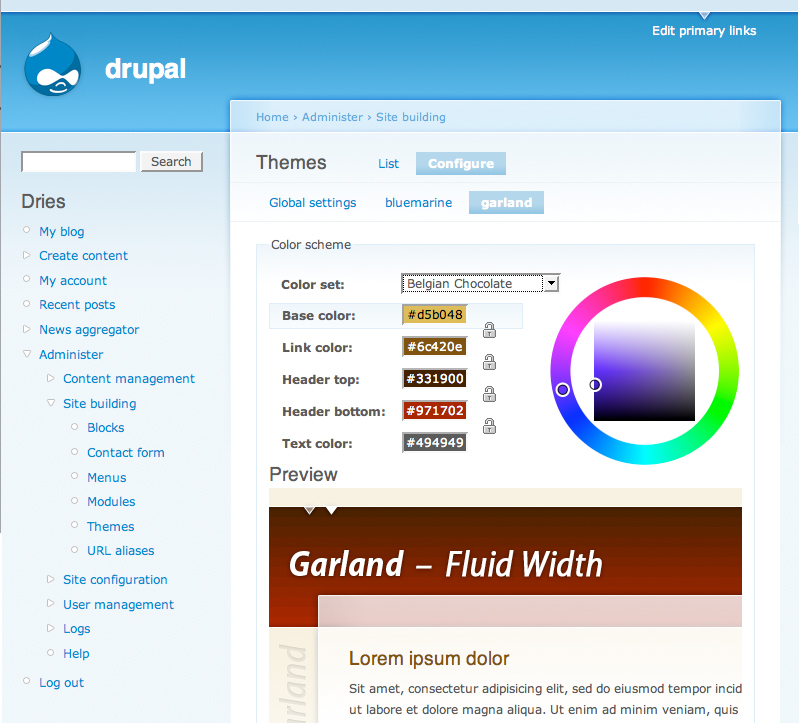 The new default core theme that will ship with Drupal 5.0. The new theme is called Garland and was created by Stefan Nagtegaal and Steven Wittens. The screenshot shows you the new theme as well as the color picker to alter the color scheme.
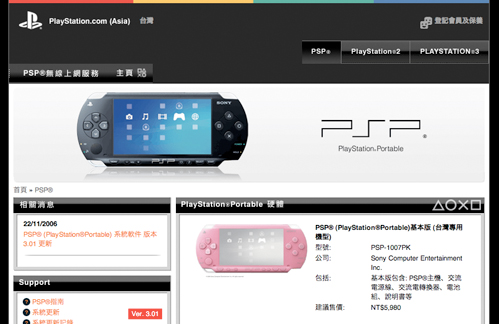 PlayStation.com (Asia) uses Drupal.
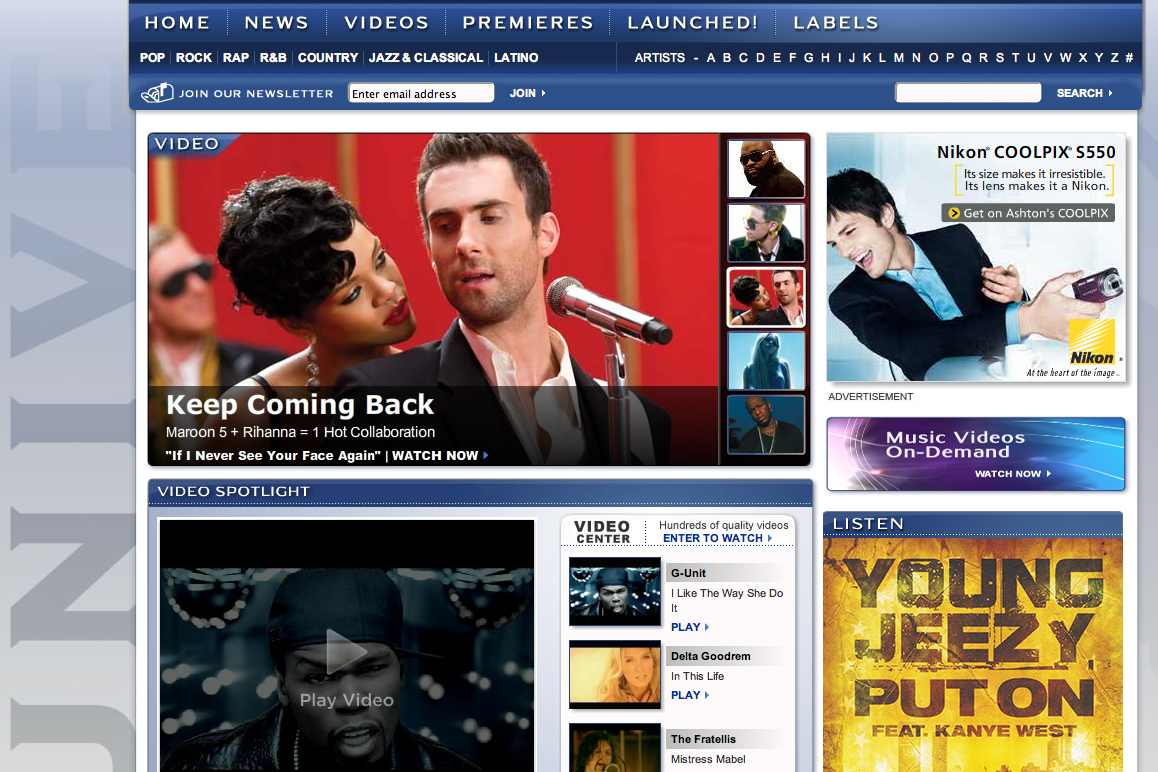
 Musicbox is a community site by Sony Music where you can watch and rate and review the music videos of all Sony artists.
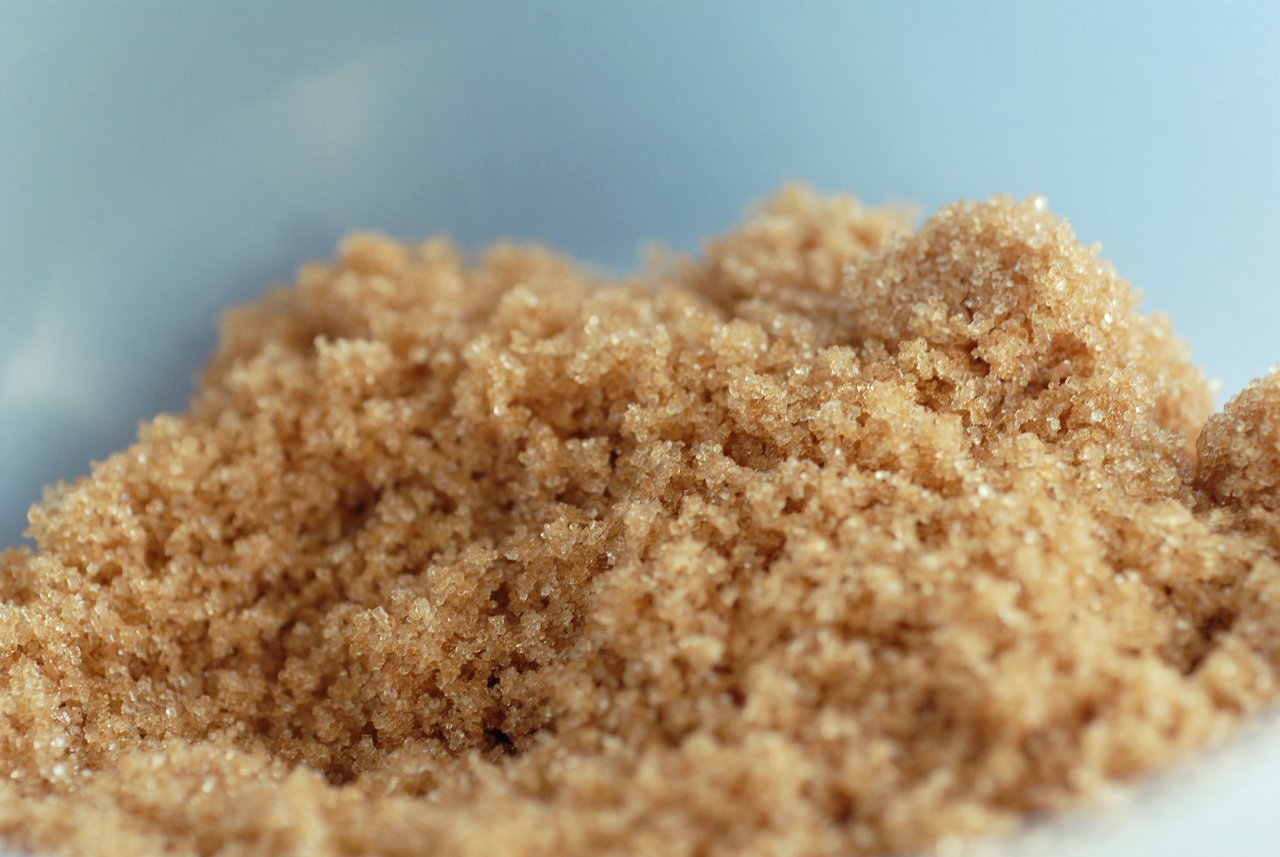 Step 2: unpack the ingredients.
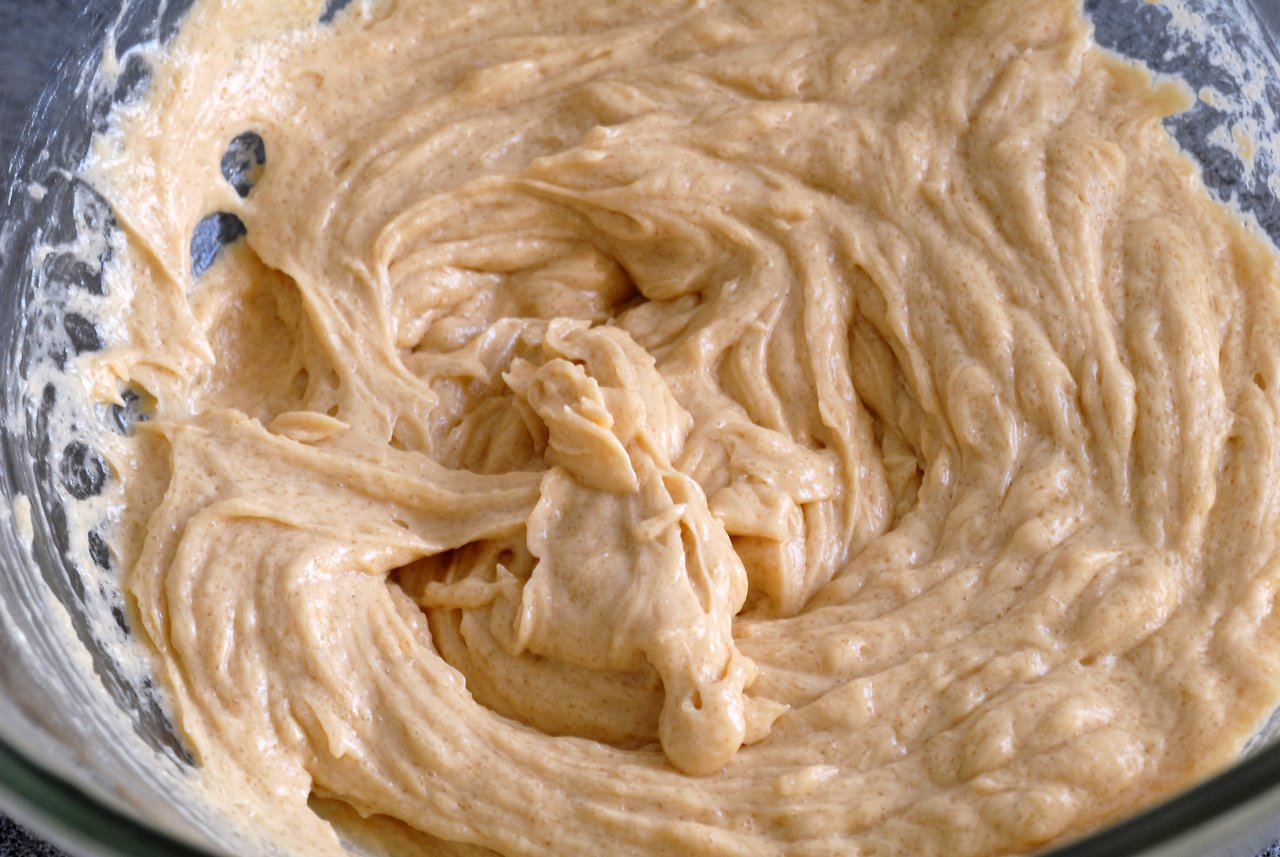 Step 3: mix all the ingredients as you would normally do.
 Step 5: bend a metal ring so it takes the shape of Druplicon (the Drupal logo).
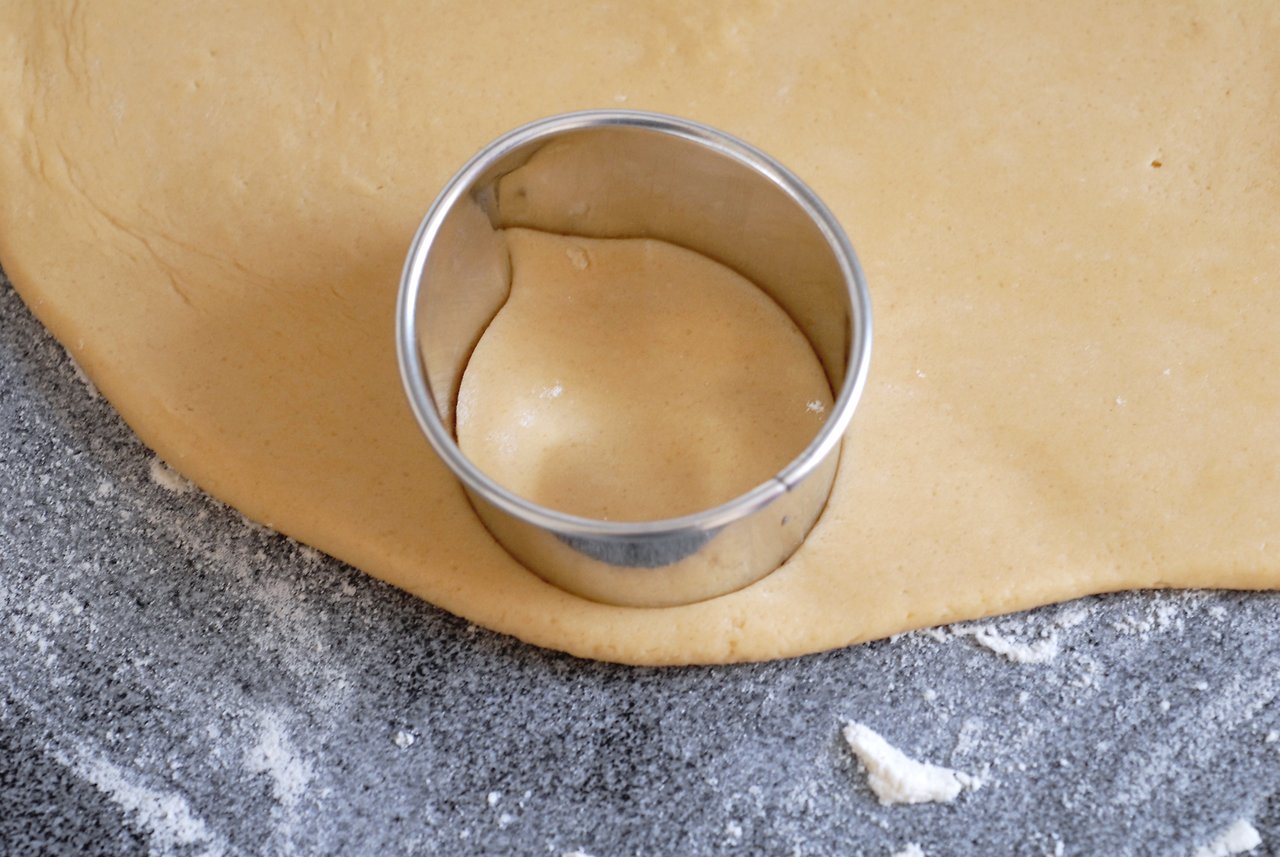 Step 6: cut Druplicons in dough using our Druplicon cookie cutter.
 Step 7: take out the Druplicon shaped dough.
 Step 9: take the cookies out of the oven.
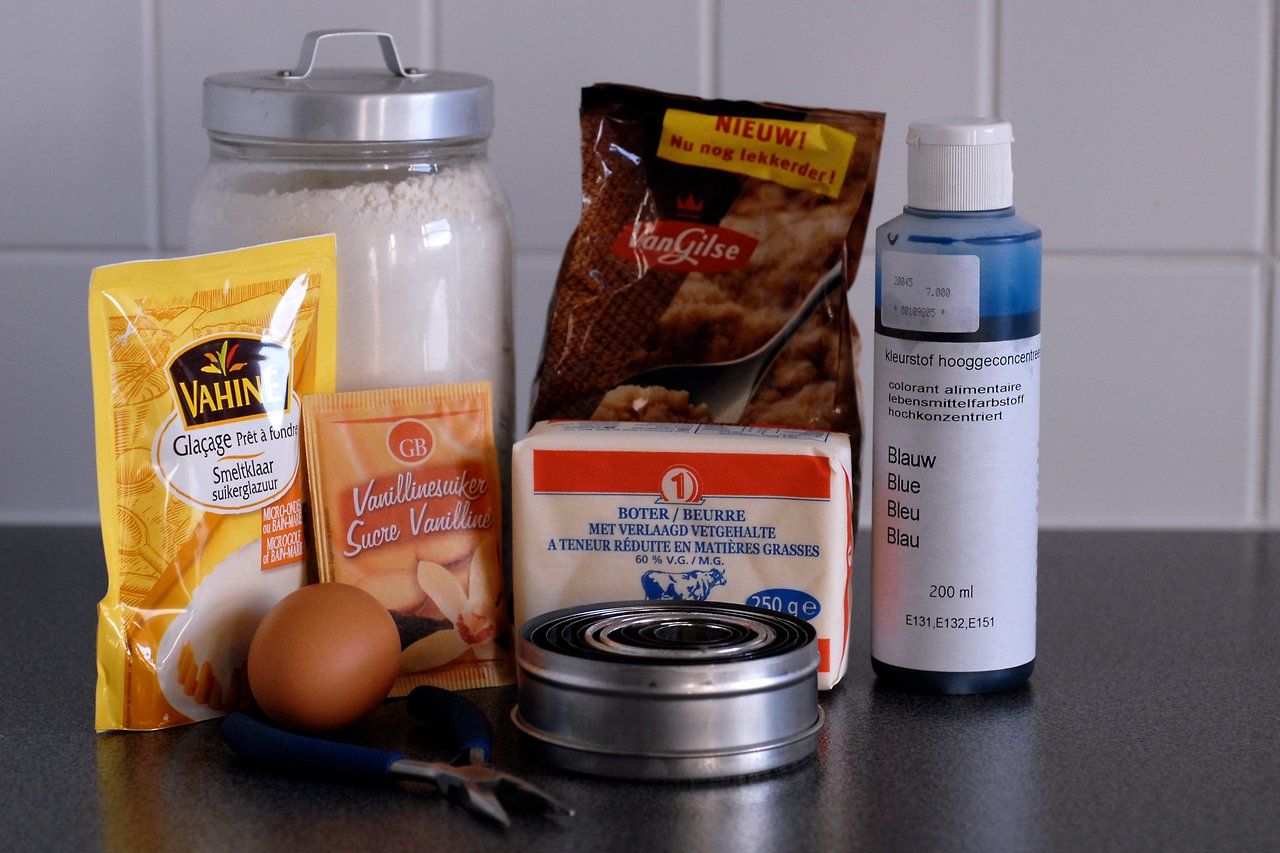 Step 1: buy the tools and the ingredients to make the cookies of your choice. Could be peanut butter cookies, oatmeal cookies or sugar cookies as long there is room for custom frosting.
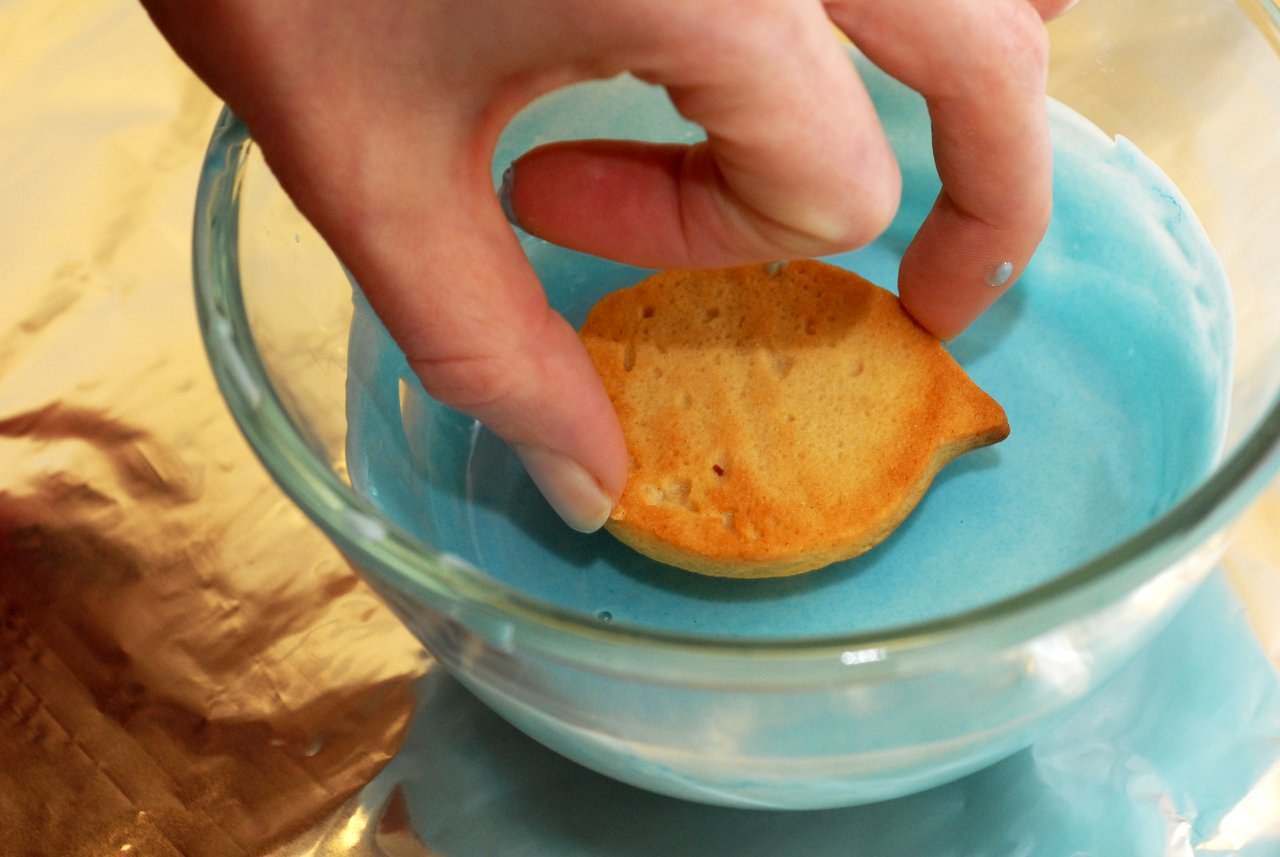 Step 11: dip the cookies into the frosting.
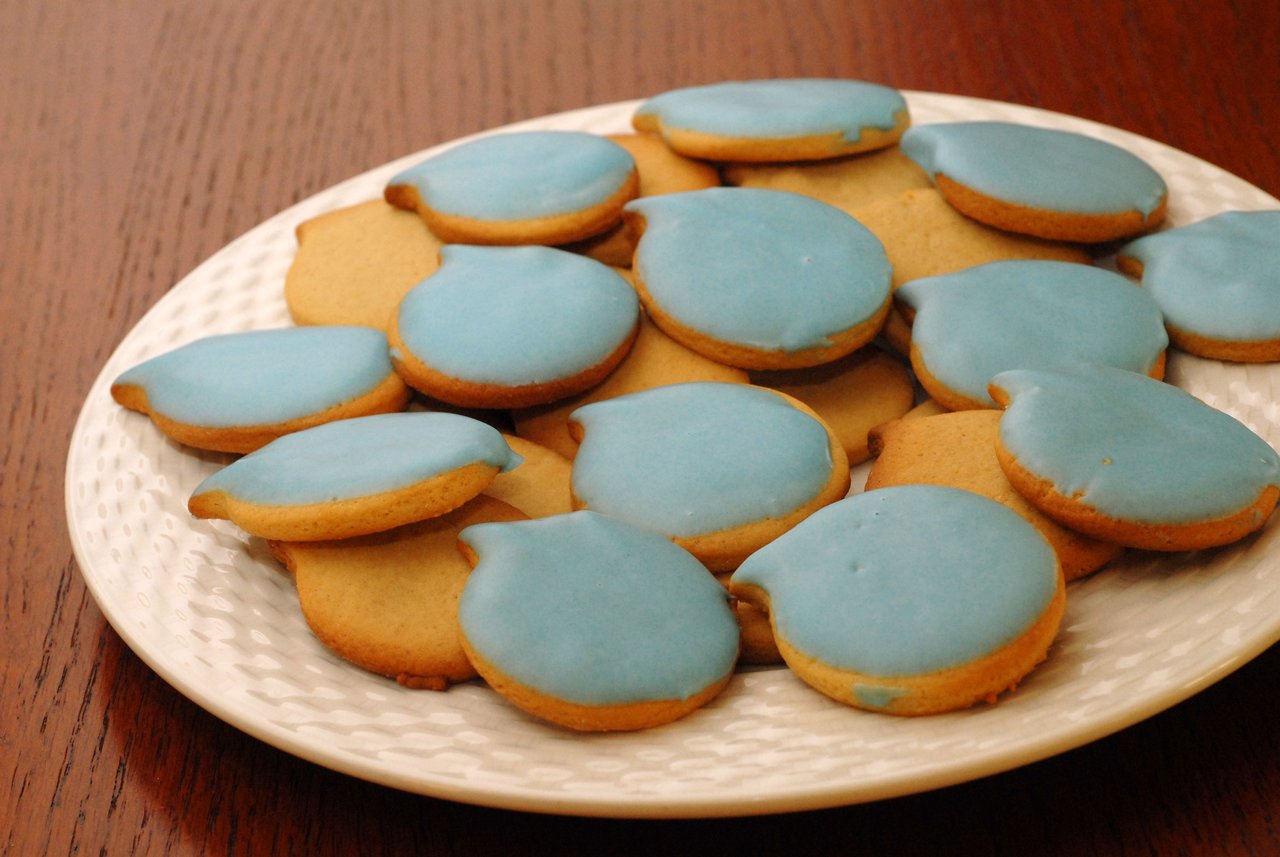 Step 13: that's it! Happy birthday Drupal!

 Step 8: put the Druplicon dough in the oven. That's my "DrupalCon Brussels" t-shirt reflecting in the oven's cover glass.
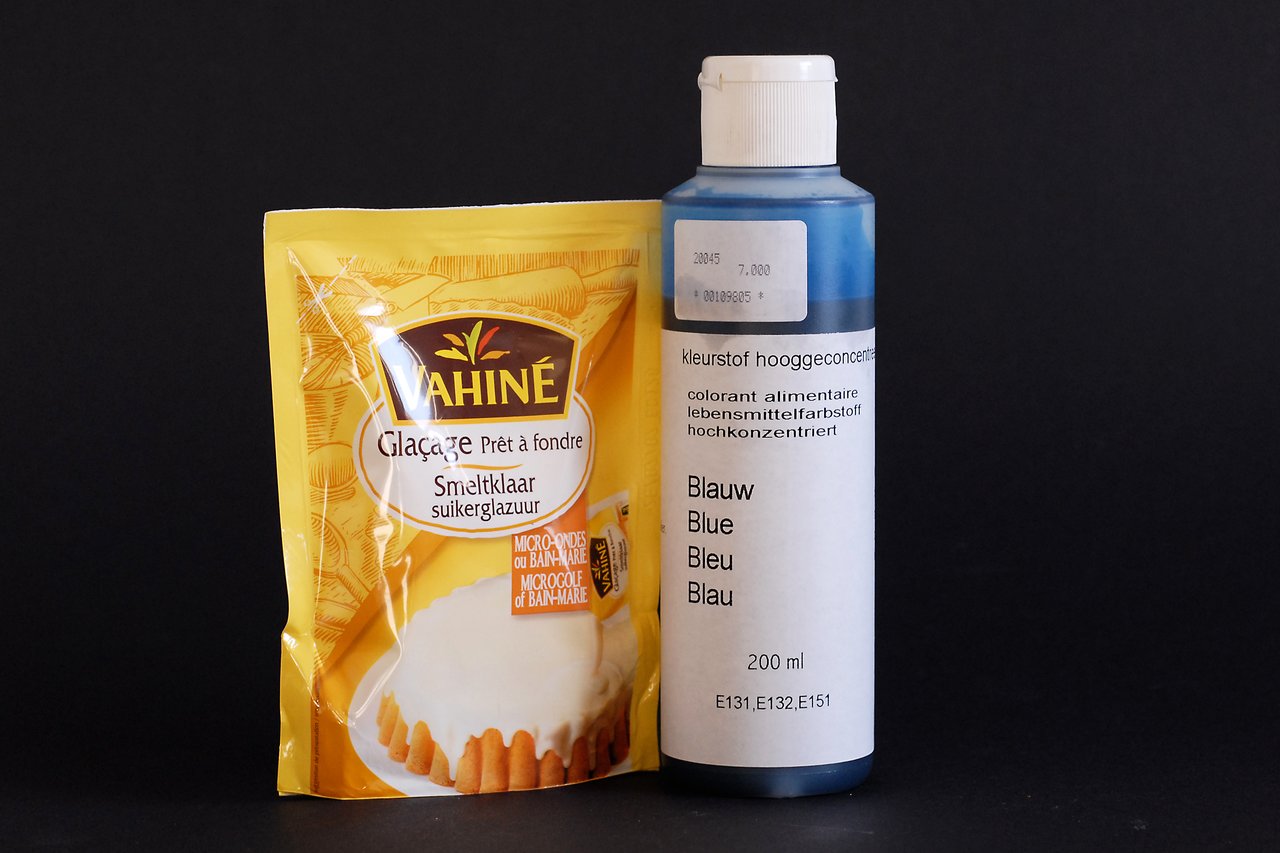 Step 10: mix the frosting with blue food coloring.
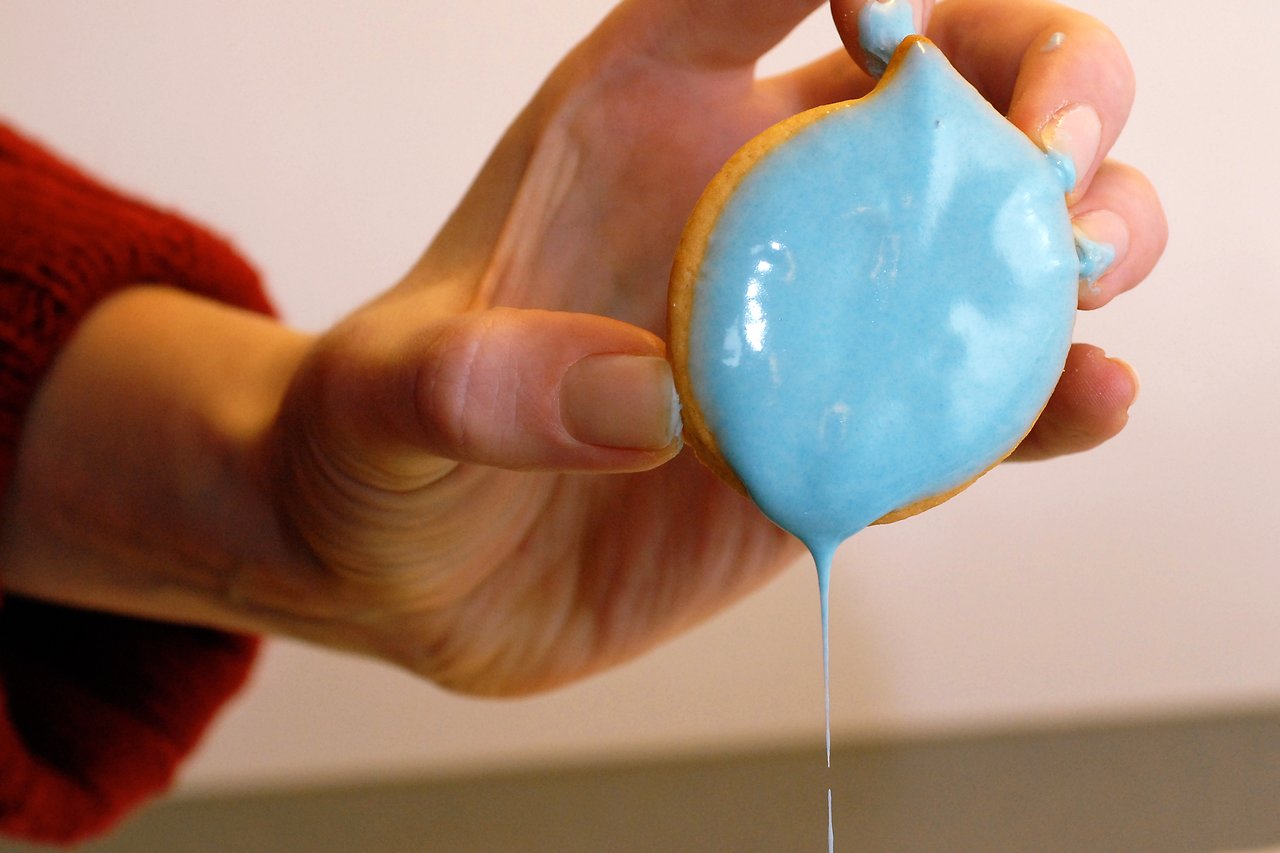 Step 12: dip the cookies in the frosting.
 A screenshot of Hillary Clinton's campaign website at http://votehillary.org.










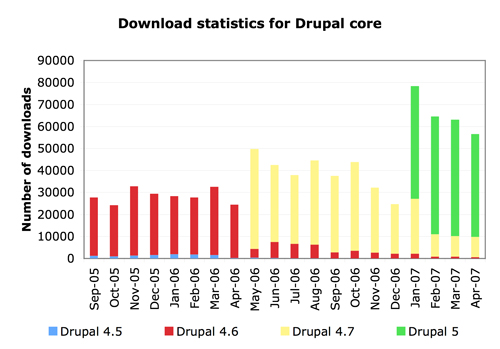
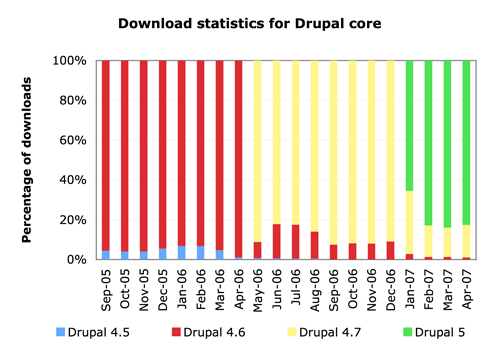
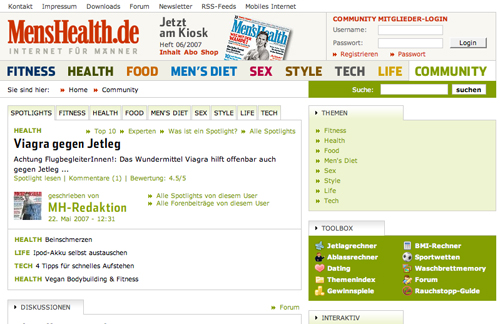
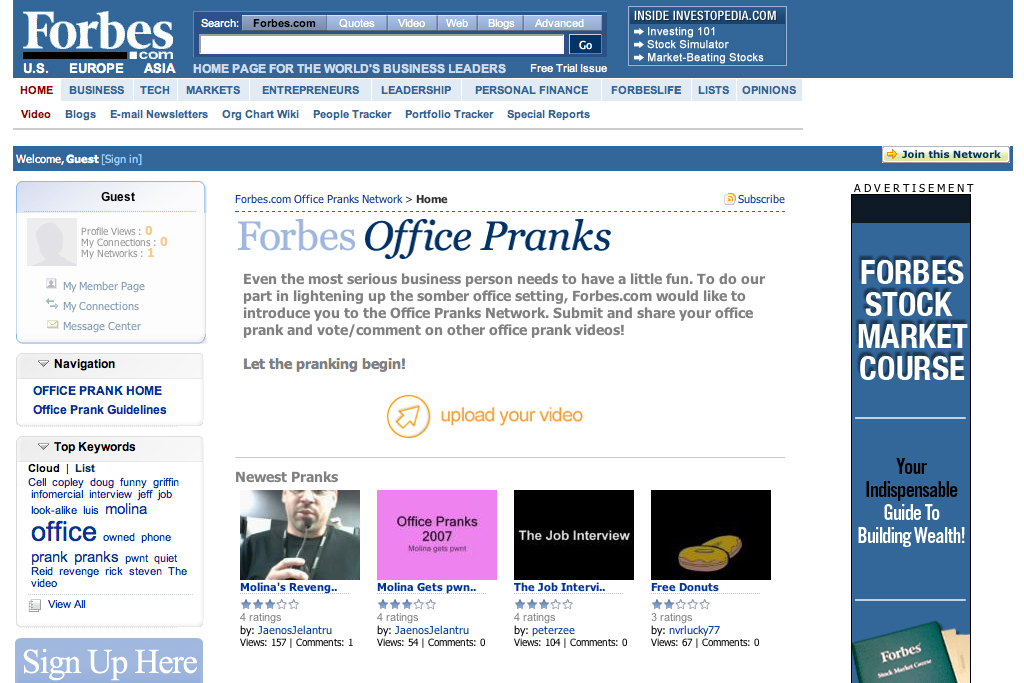


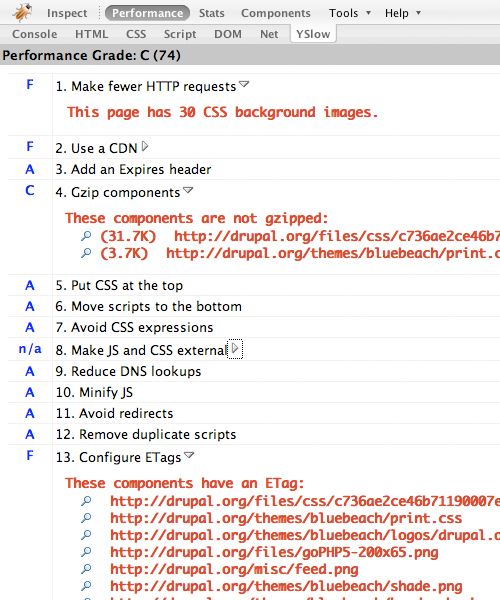 The current YSlow score for the drupal.org front page is 74 (C). YSlow suggests that we reduce the number of CSS background images using CSS sprites, that we use a Content Delivery Network (CDN) like Akamai for delivering static files, and identifies an Apache configuration issue that affects the Entity Tags or ETags of static files. The problem is that, by default, Apache constructs ETags using attributes that make them unique to a specific server. A stock Apache embeds inode numbers in the ETag which dramatically reduces the odds of the validity test succeeding on web sites with multiple servers; the ETags won't match when a browser gets the original component from server A and later tries to validate that component on server B.





 Good morning world! Remember, sleep is no substitute for good coffee.




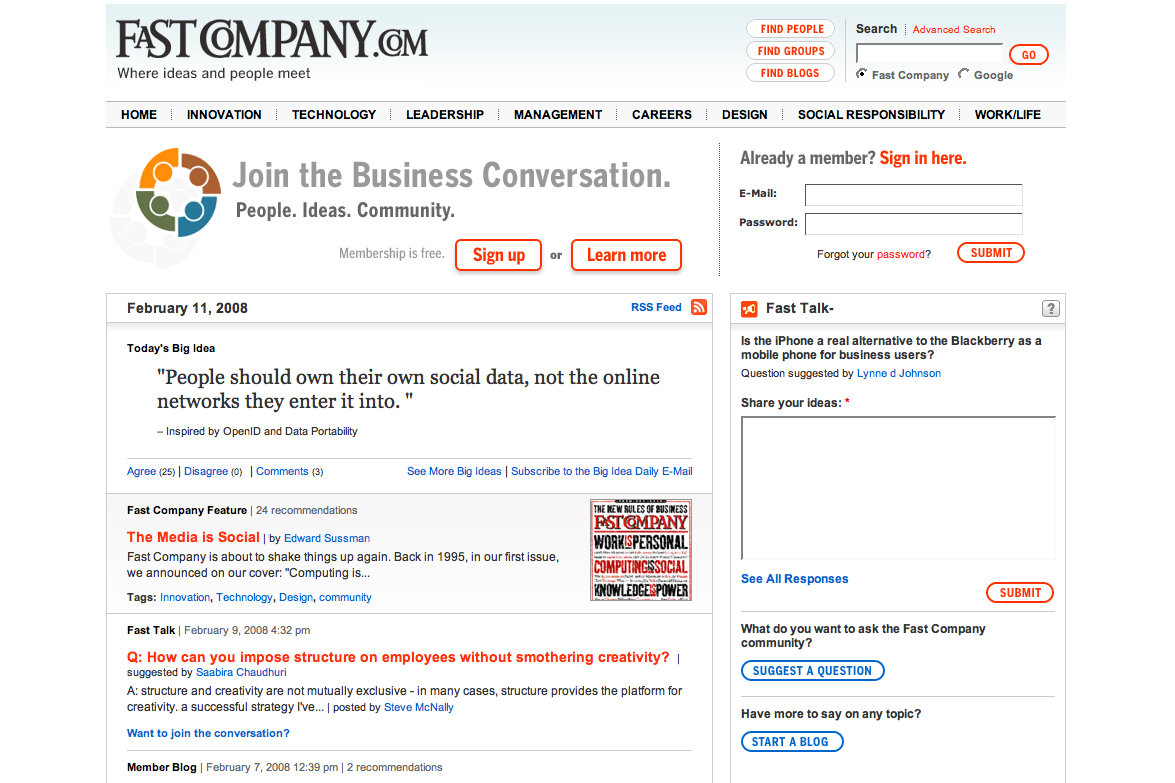
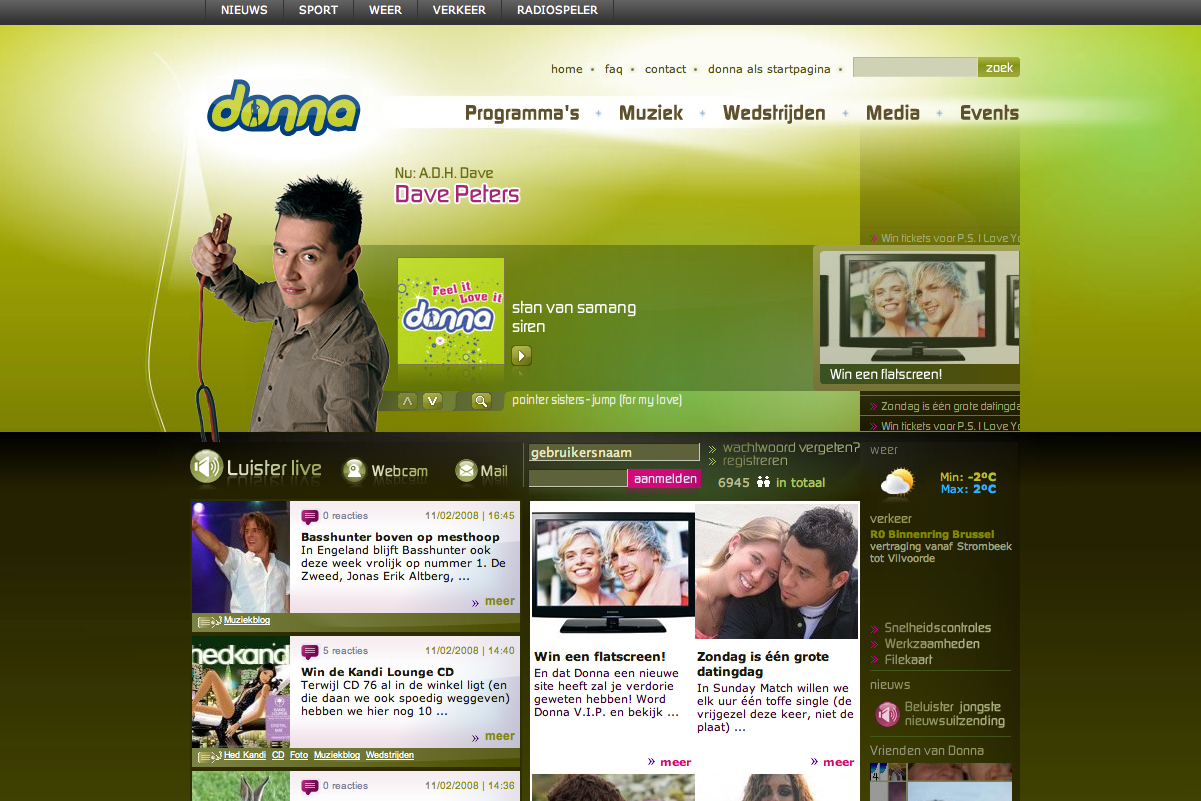
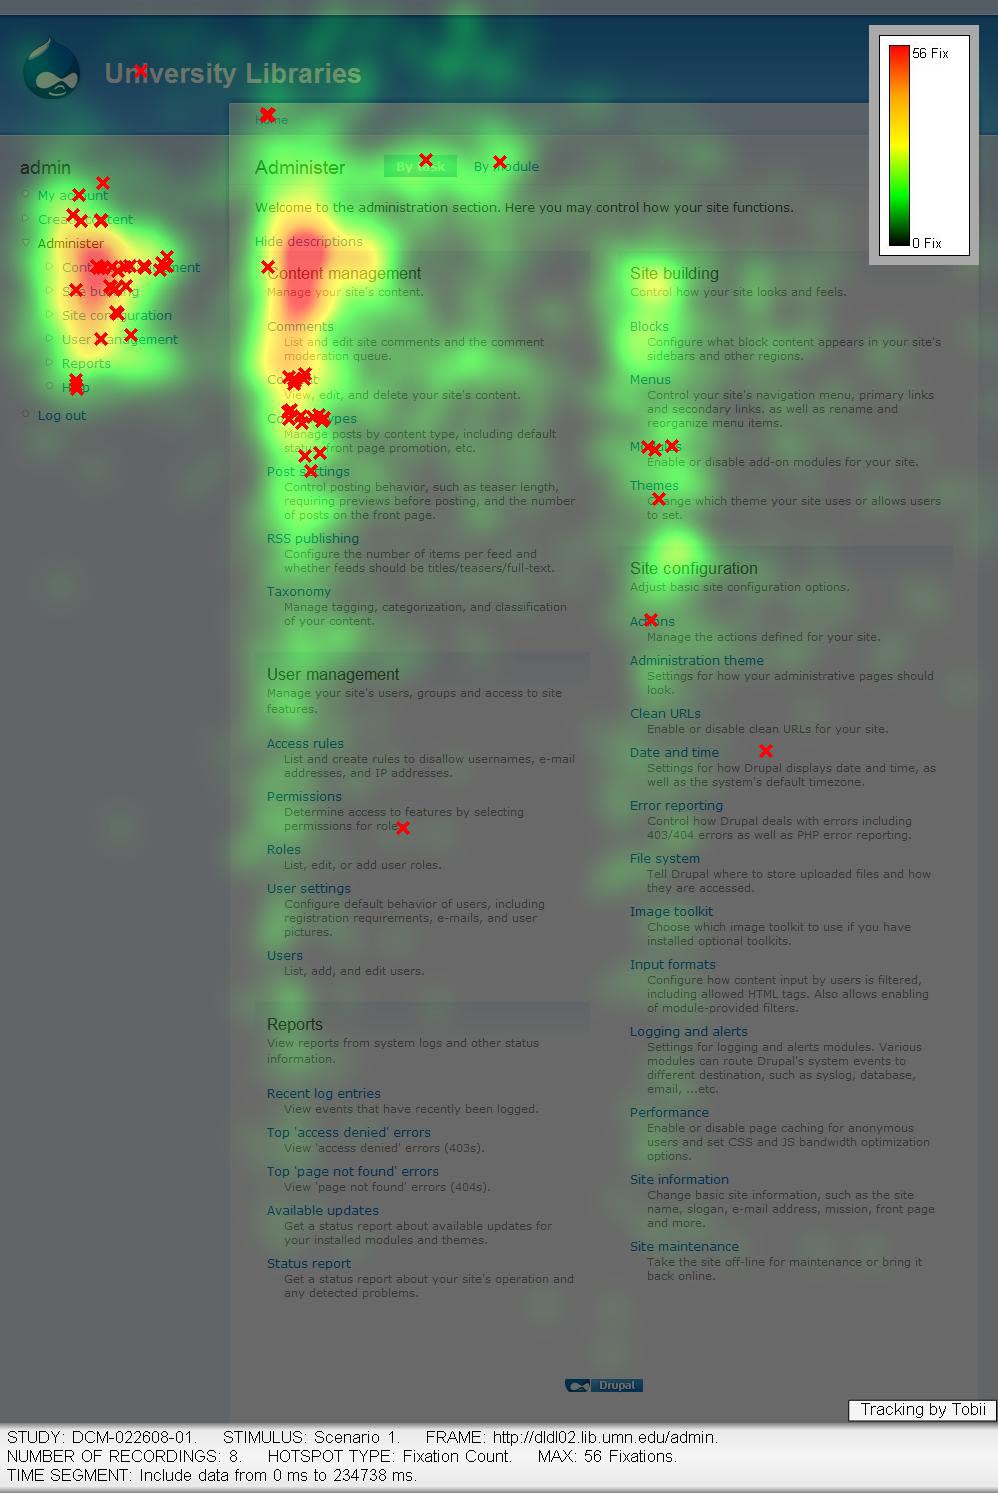 The heat map shows where the users look the first 5 seconds after landing on Drupal's main administration page. The red X's show where the users clicked.
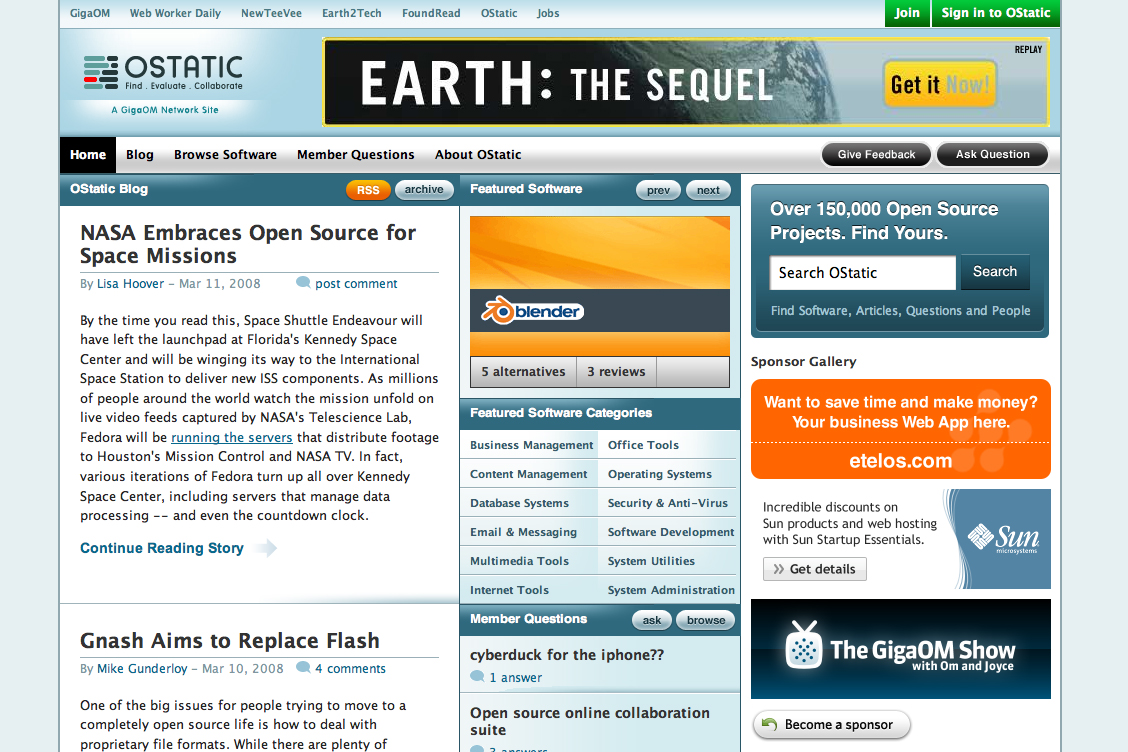

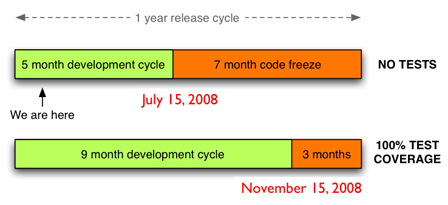 The Drupal 7 timeline assuming that we fully embrace testing.
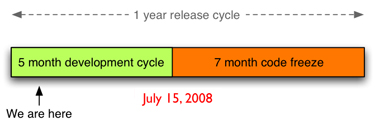 The projected Drupal 7 timeline based on the actual Drupal 6 timeline.
 The actual Drupal 6 timeline.
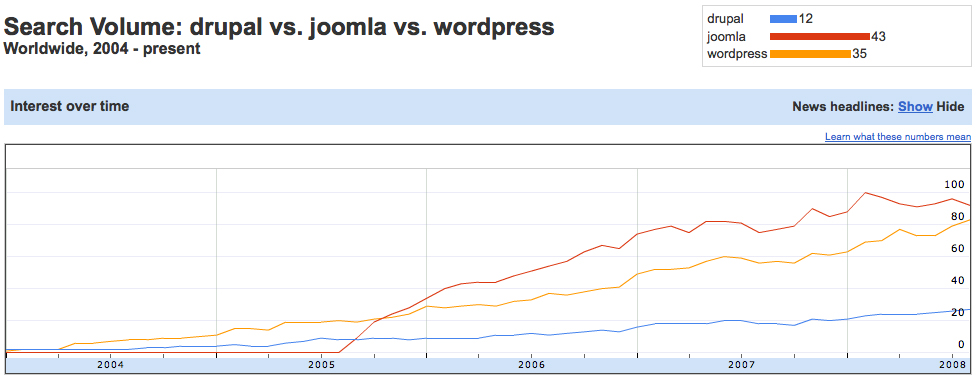 The numbers on the graph reflect how many searches have been done for a particular term, relative to the total number of searches done on Google over time. See Google Insights results for Drupal. © Google.
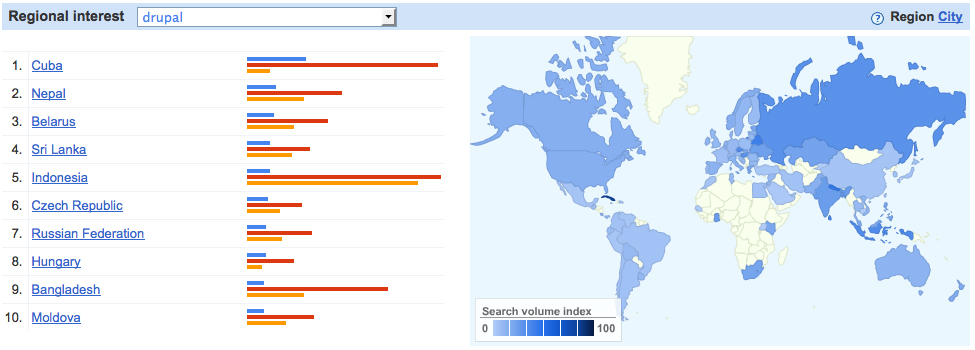 Regional Drupal interest by country. Google uses the term 'search volume index' for these heatmaps, meaning that they normalized the data by the total traffic from each respective region. In other words, just because two regions show the same percentage for a particular term doesn't mean that their absolute search volumes are the same. See Google Insights results for Drupal. © Google.
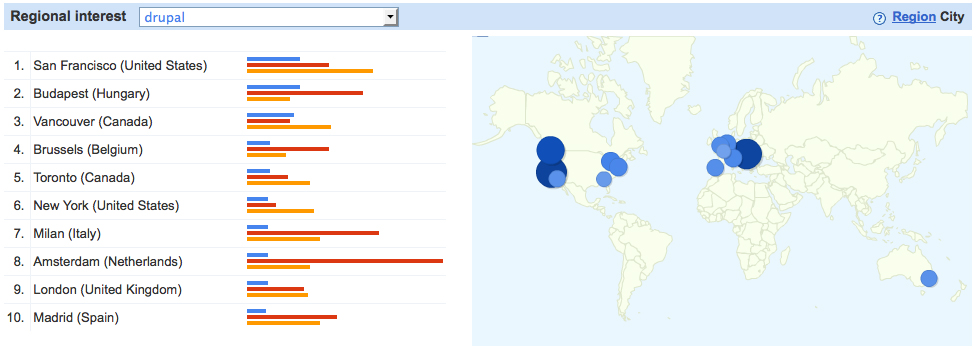 Regional Drupal interest by city. Based on 'search volume index'. See Google Insights results for Drupal. © Google.
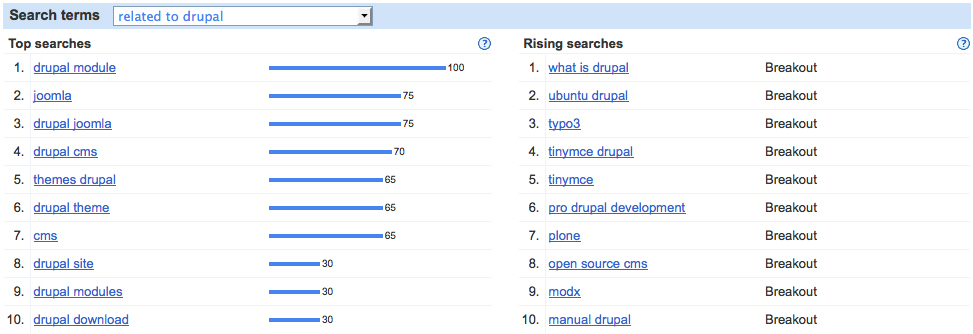 The top search on Drupal -- great for marketing people. Breakout means that the search term has experienced a change in growth greater than 5000%. See Google Insights results for Drupal. © Google.
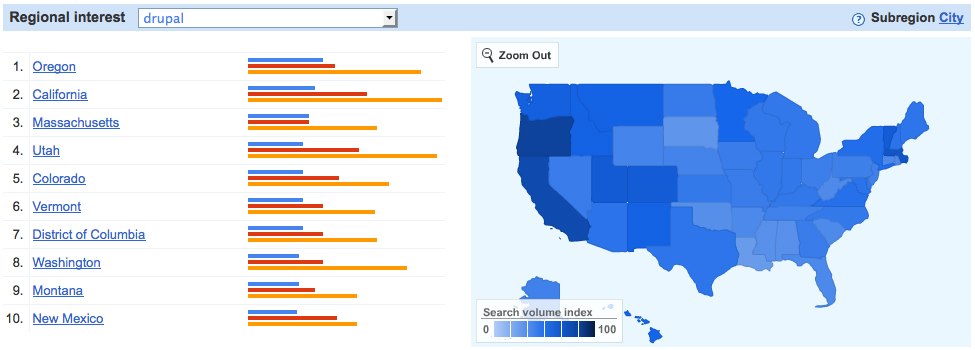 In the US, the west coast beats the east coast. Based on 'search volume index'. See Google Insights results for Drupal. © Google.
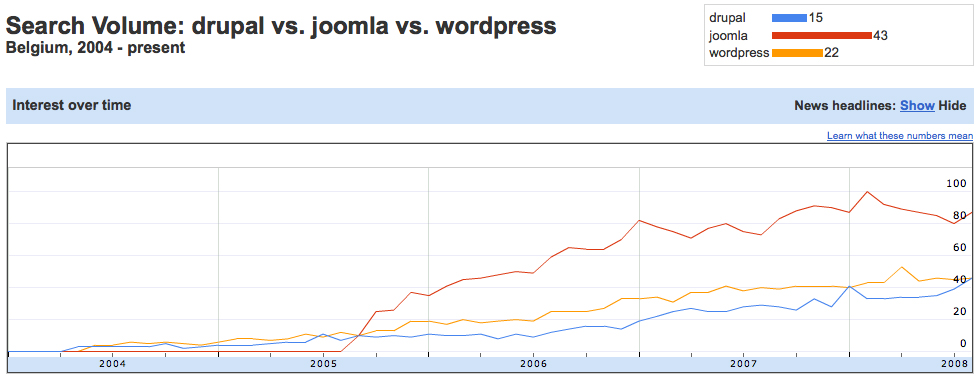 In my home country, Belgium, Drupal is almost as strong as Wordpress but not nearly as strong as Joomla. See Google Insights results for Drupal. © Google.
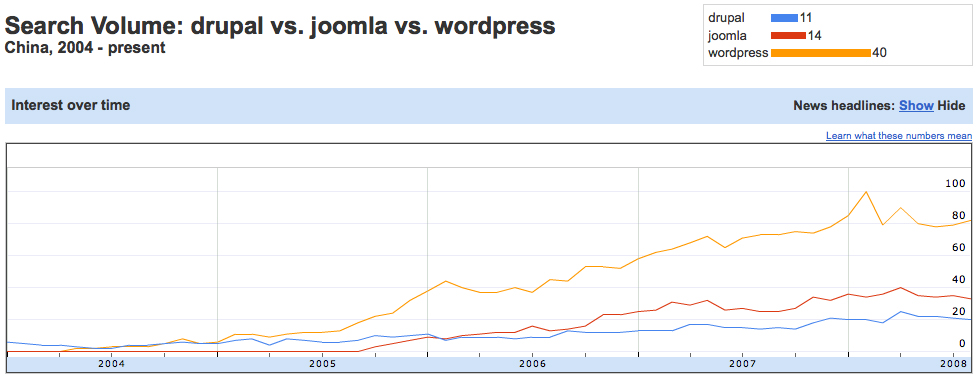 In China, Wordpress is winning hands down. See Google Insights results for Drupal. © Google.

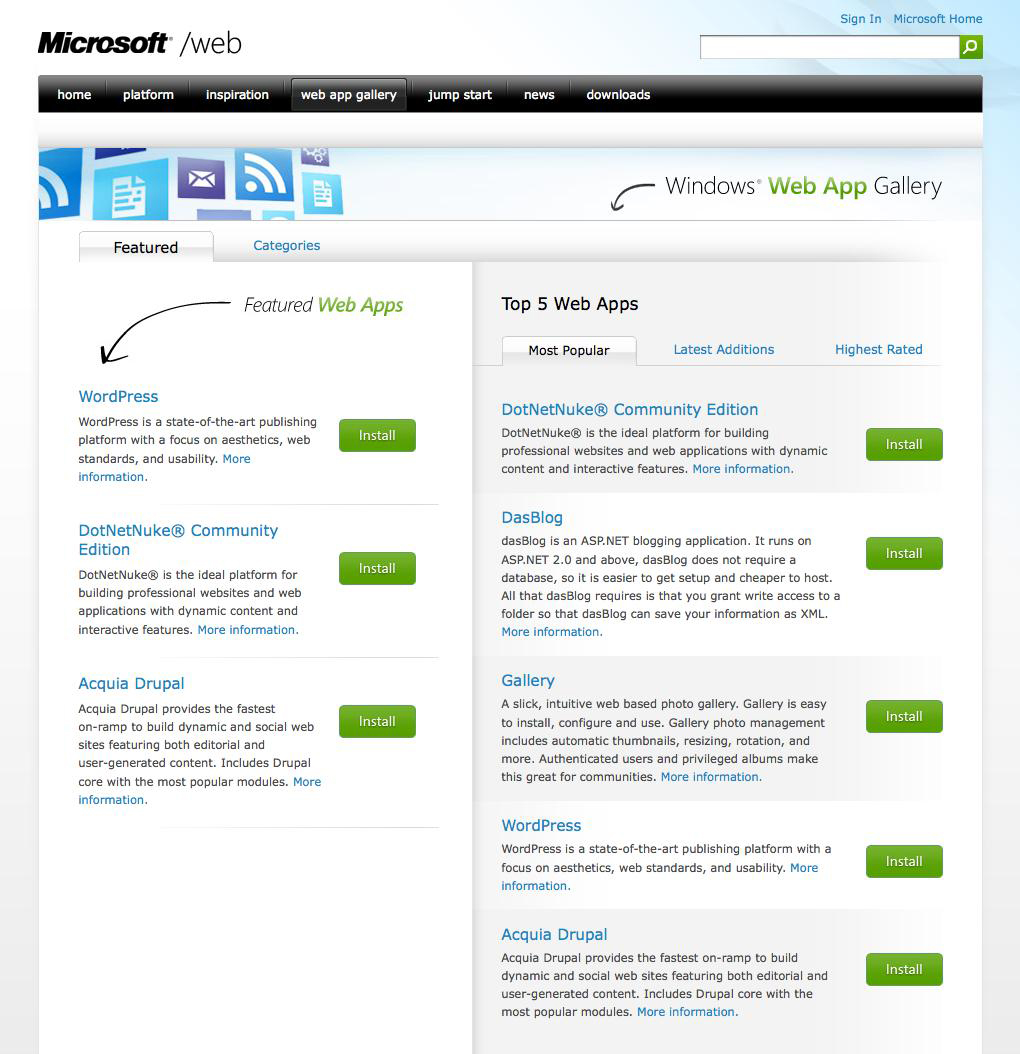
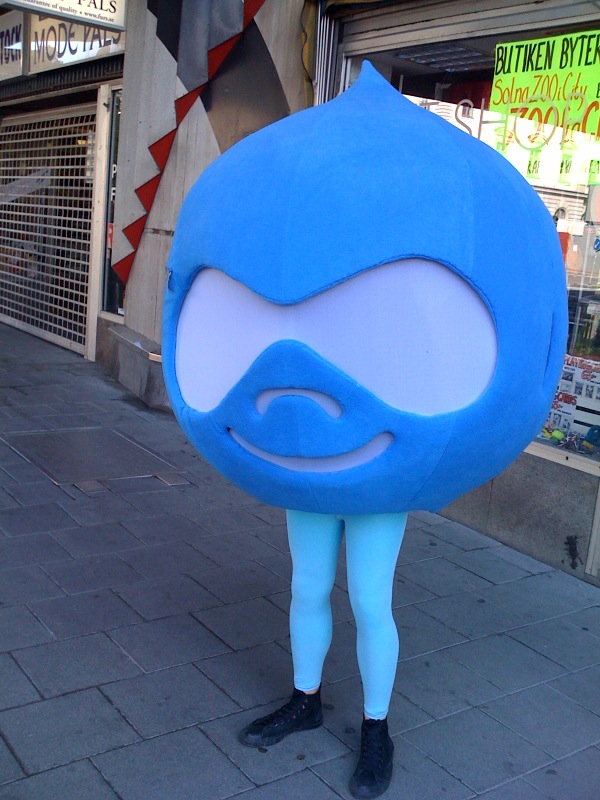 © Nabot.
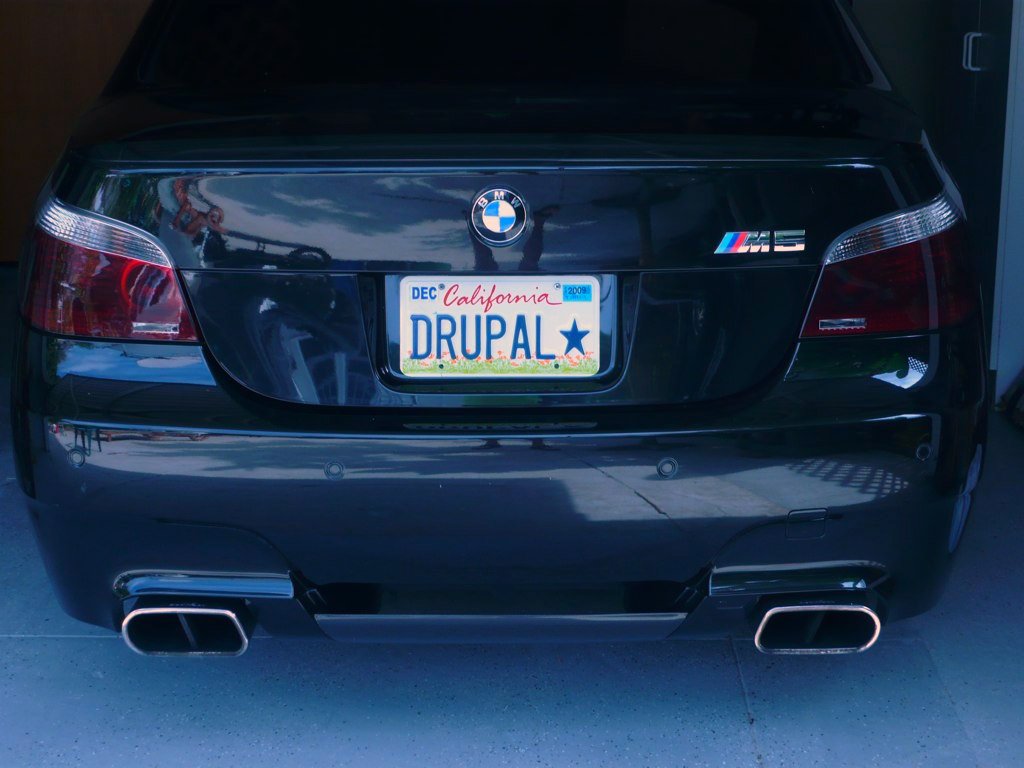 A car spotted with a 'Drupal star' license plate.
 © iStock.com/crisserbug.

 © Christopher Galluzzo.


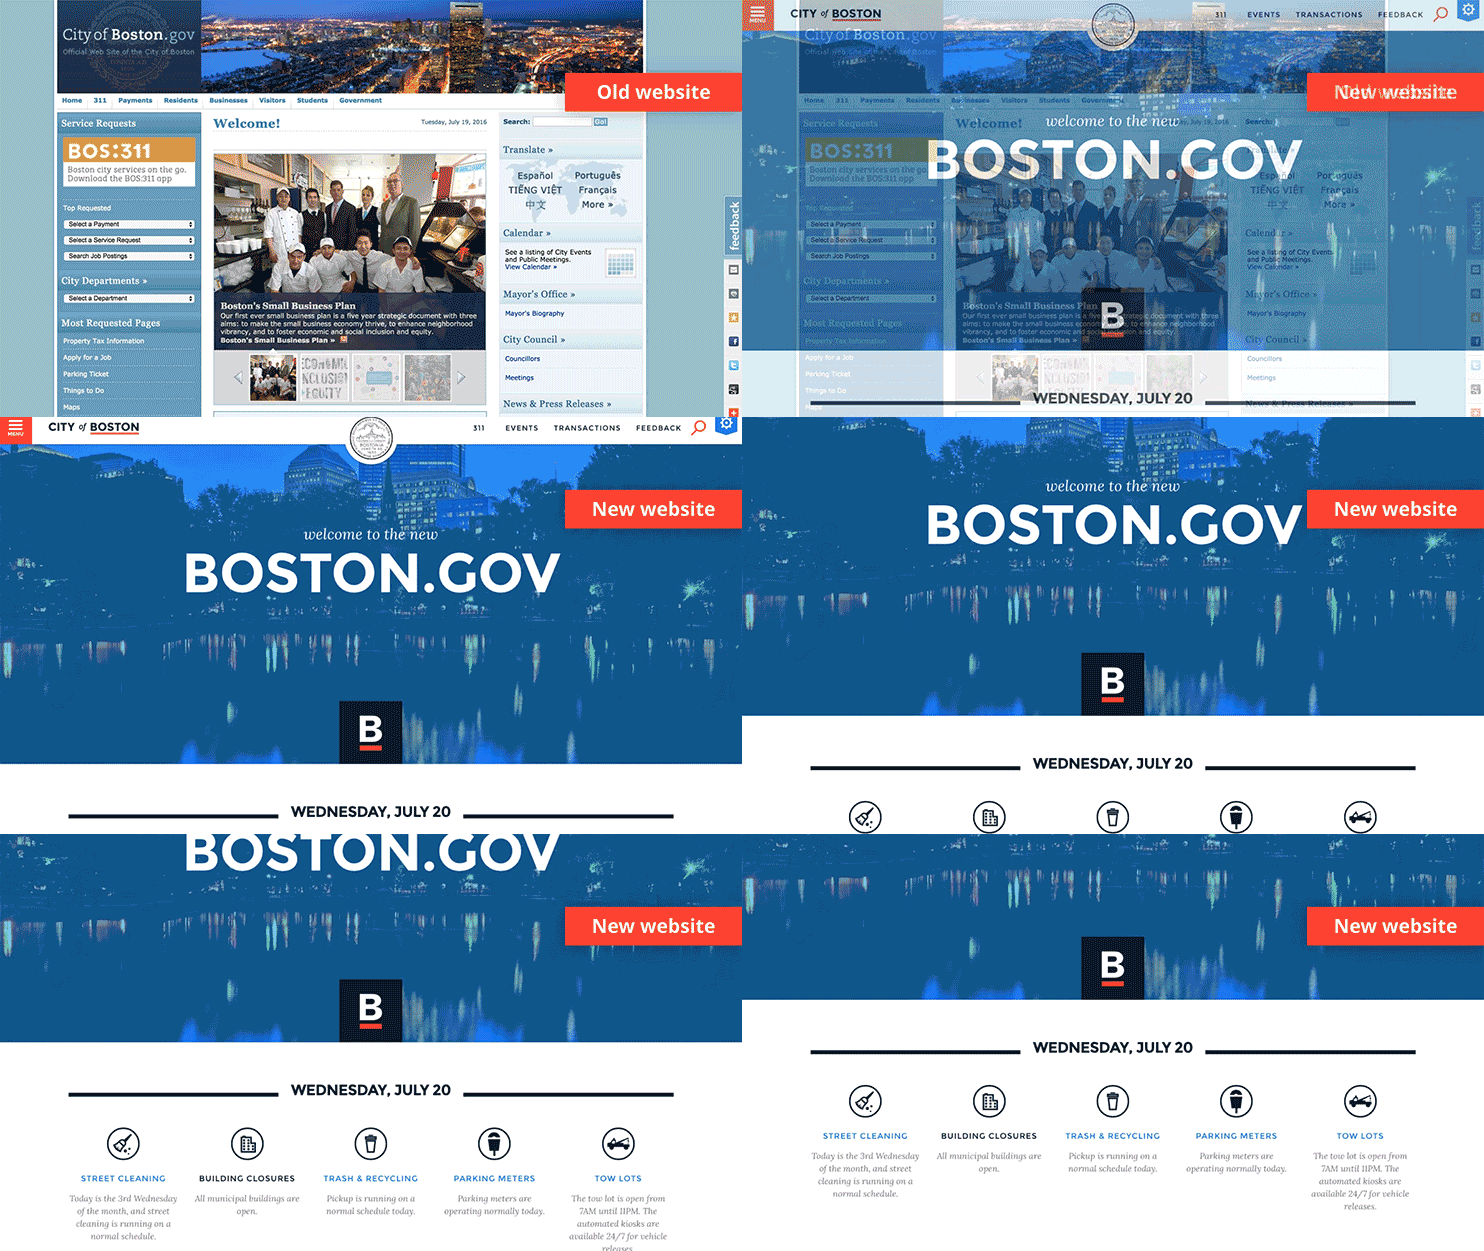
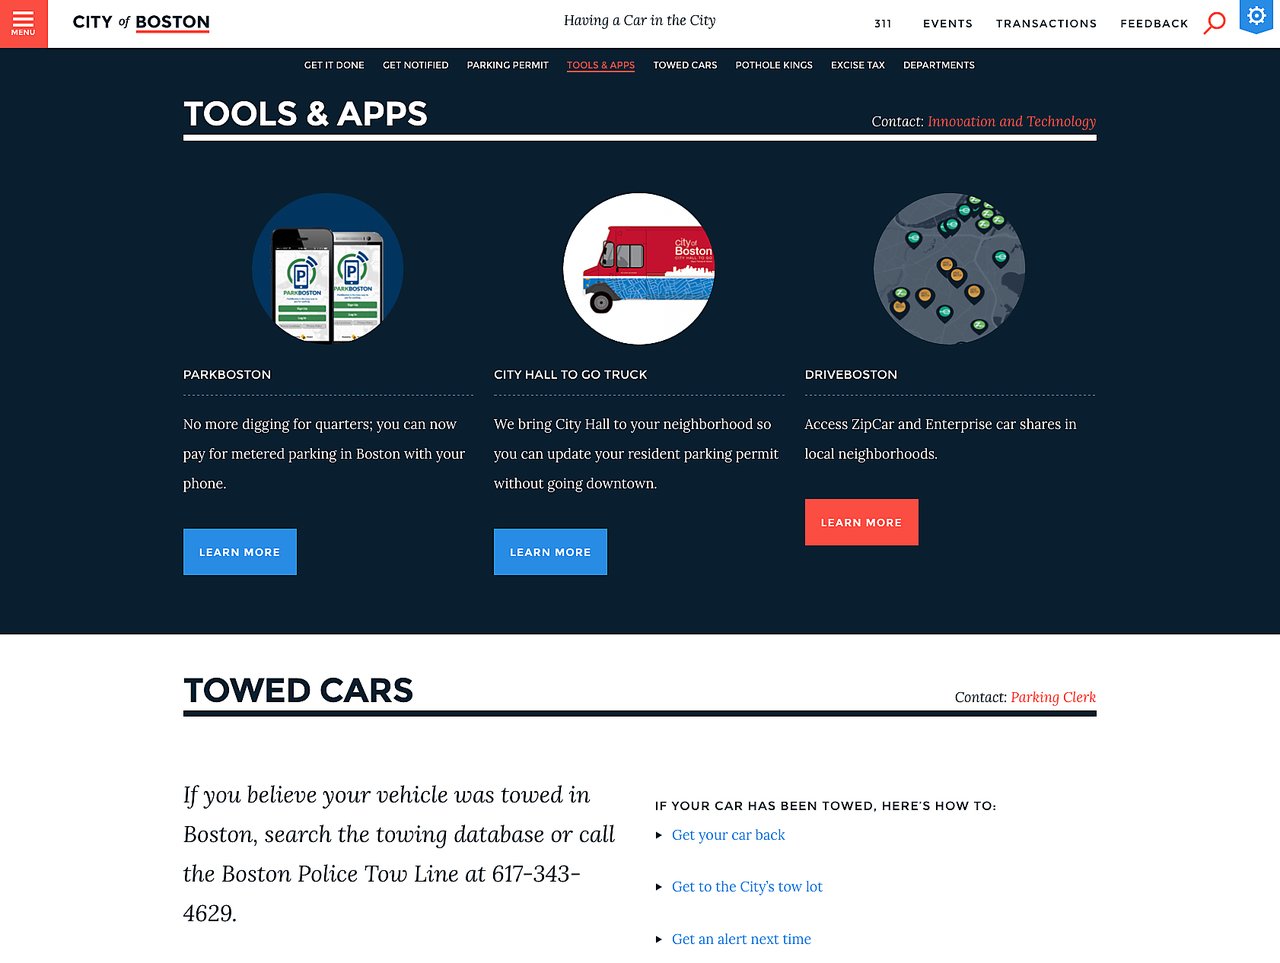
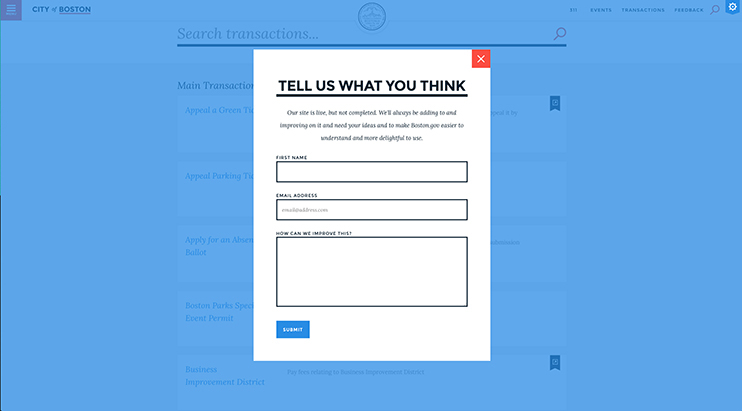
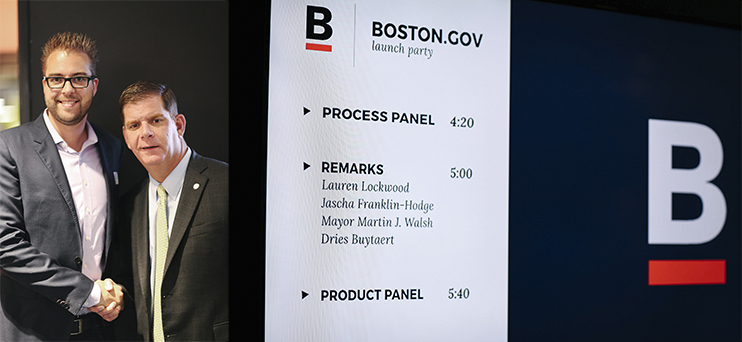 Last night there was a launch party to celebrate the launch of Boston.gov. It was an honor to give some remarks about this project alongside Boston Mayor Marty Walsh (pictured above), as well as Lauren Lockwood (Chief Digital Officer of the City of Boston) and Jascha Franklin-Hodge (Chief Information Officer of the City of Boston).
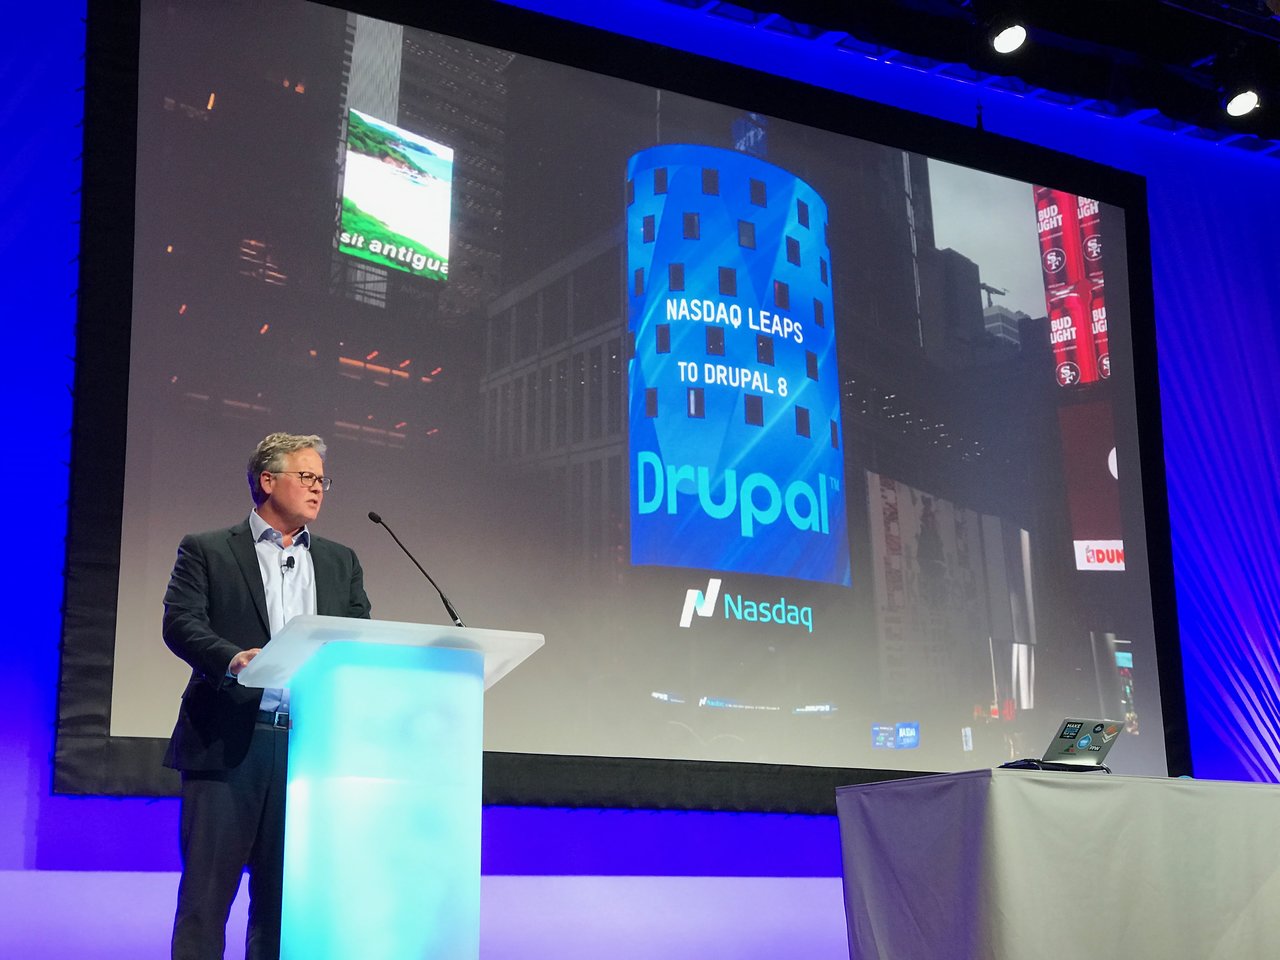 Nasdaq CIO and vice president Brad Peterson at the Acquia Engage conference showing the Drupal logo on Nasdaq's MarketSite billboard at Times Square NYC.
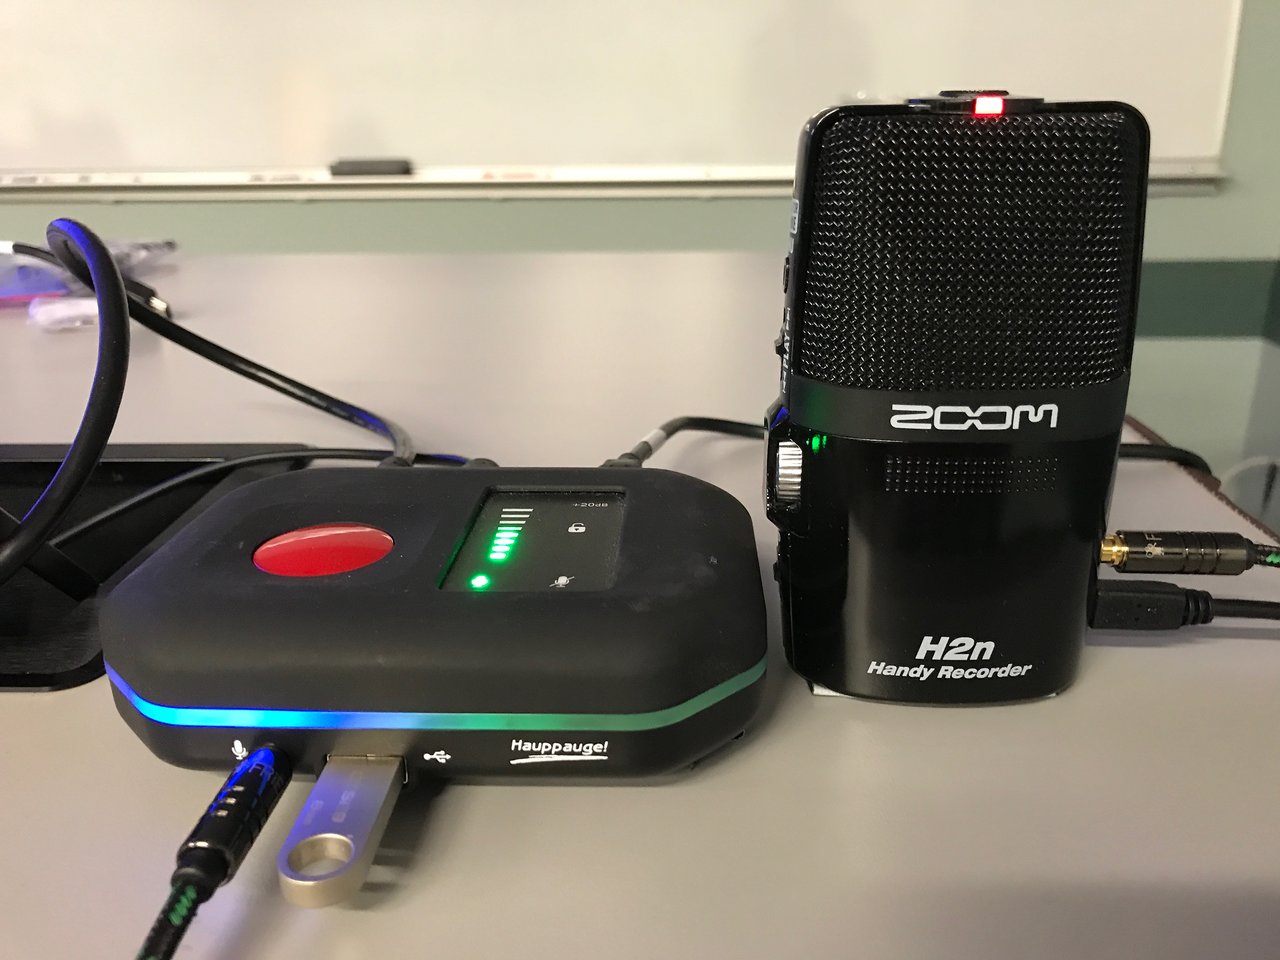 This is one of Kevin Thull's recording kits used to record hundreds of Drupal presentations around the world. Each kit runs at about $450 on Amazon.
 © Ultra-trail Snowdonia and No Limits Photography.
 © Ultra-trail Snowdonia and No Limits Photography.

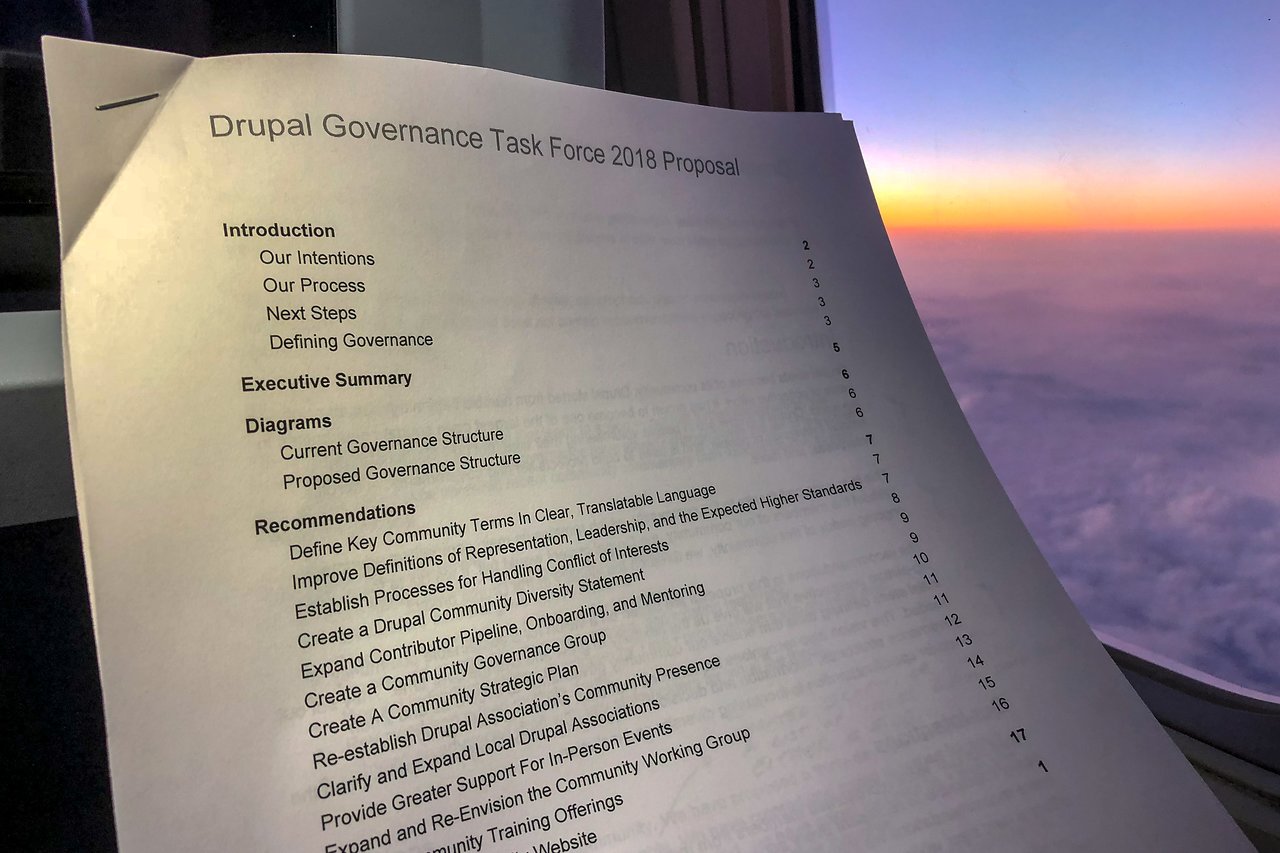 Me reviewing the Drupal Governance proposal on a recent trip.




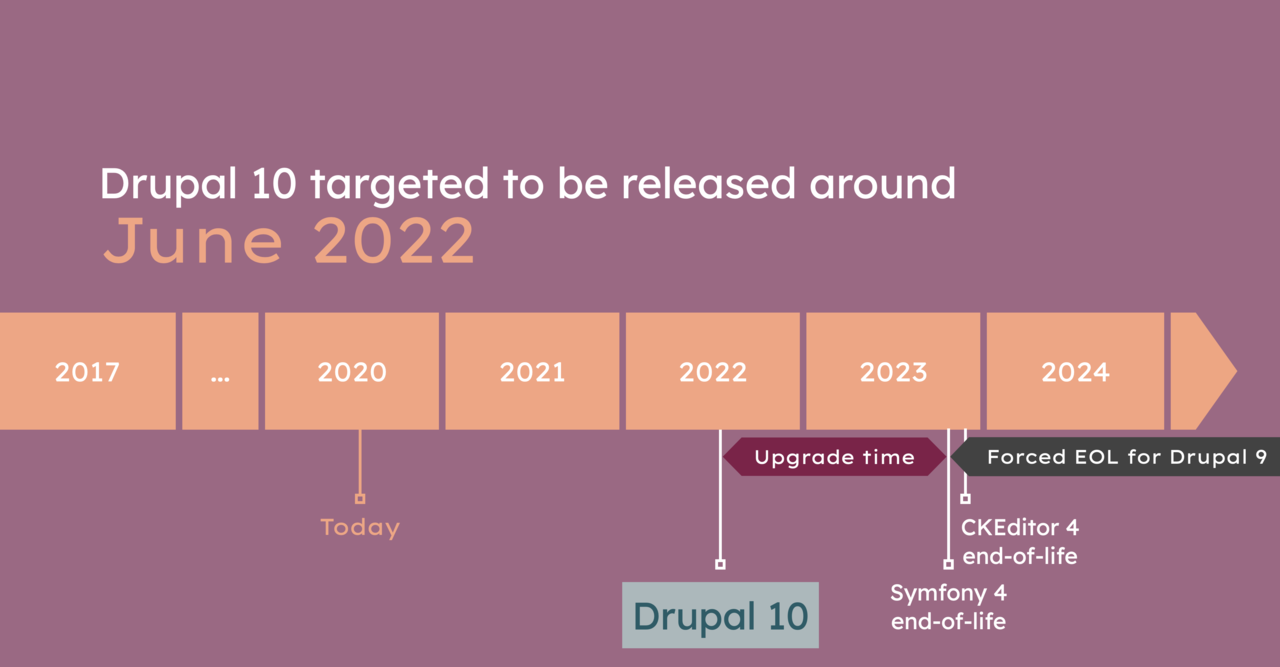
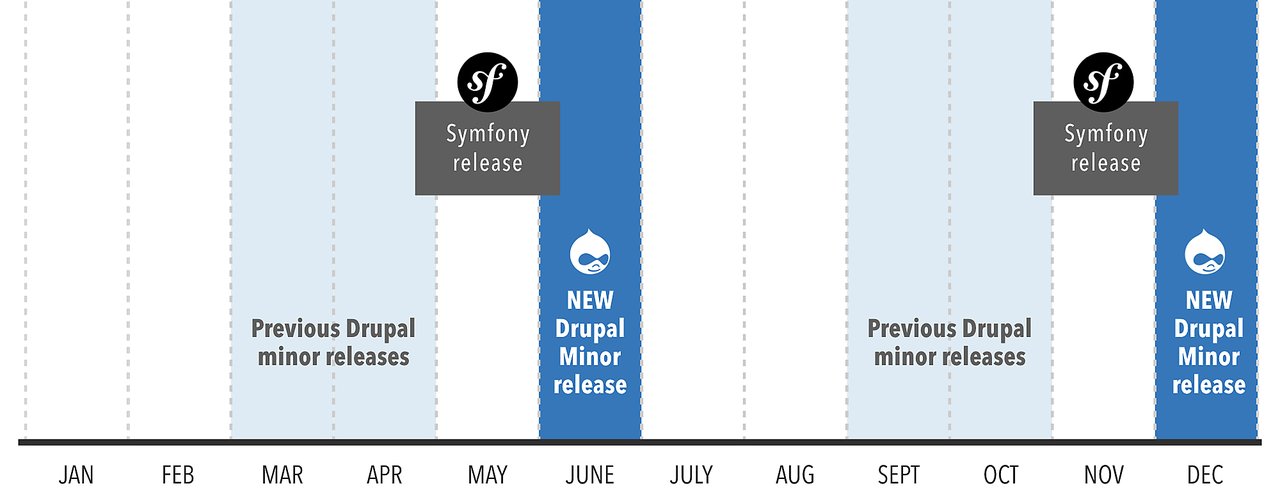 We shifted Drupal 8's minor release windows so we can adopt Symfony's releases faster.