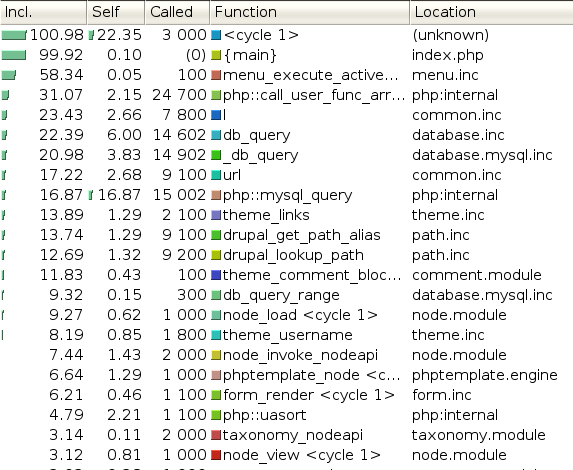
This figure shows how much time is spent in each function. The functions are sorted by the 'Incl' column, which shows the time spent in each function including the time spent in the function's children. The third column shows how often the function was called to serve 100 requests to the main page.