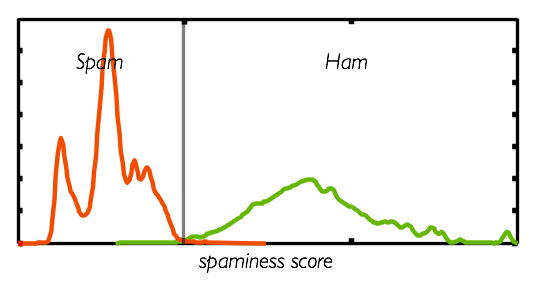
The plot illustrates that having a binary classifier with only two states (ham and spam) is bound to make mistakes. The plot is generated from the actual data in Mollom's database. April 2008 · Mollom