The Y-axis shows the number of requests per second. The X-axis shows the day of the month. The graph is for one Mollom server only. Mollom
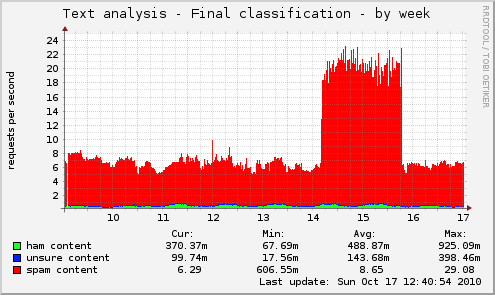 The Y-axis shows the number of requests per second. The X-axis shows the day of the month. The graph is for one Mollom server only.