Drupal contributor statistics
I recently extracted some data from the Drupal project's CVS and Git logs to see how the number of code contributors and total contributions have changed over time. If there was any doubt of our continual growth, the resulting charts demolish it.
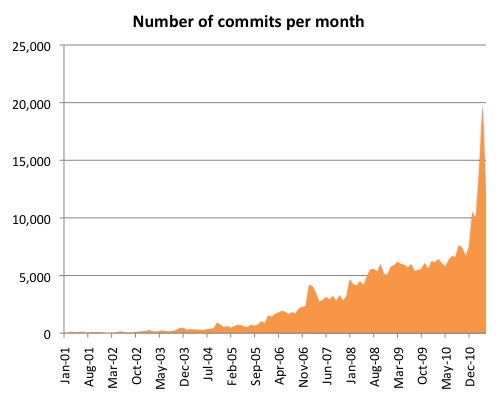
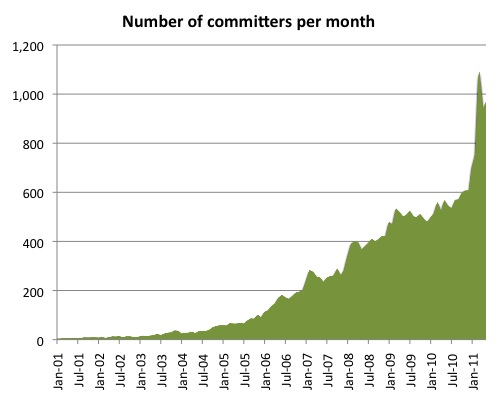
As can be seen from the graphs, there is a pretty big spike in commit activity post-Git migration.