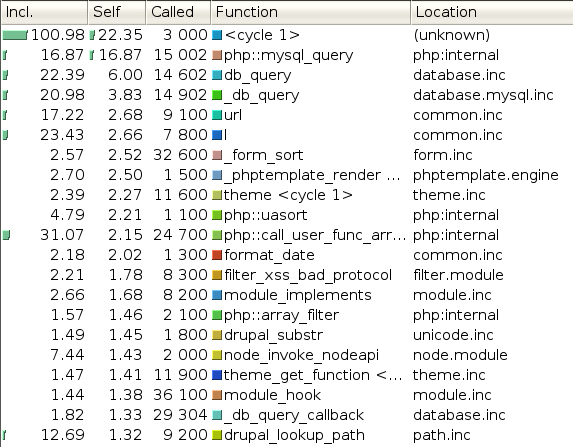
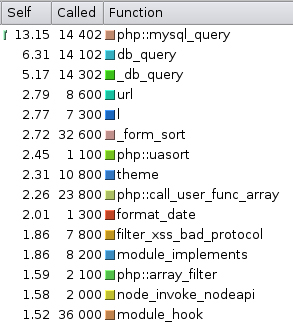
This figure shows how much time is spent in each function. The functions are sorted by the 'Self' column, which shows the time spent in each function without the time spent in its children. The third column shows how often the function was called to serve 100 requests to the main page.
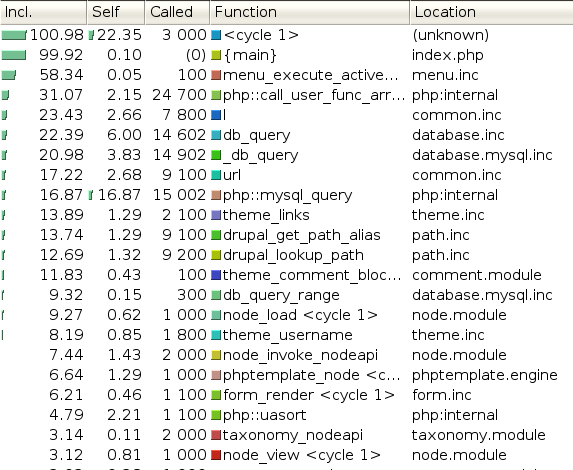
This figure shows how much time is spent in each function. The functions are sorted by the 'Incl' column, which shows the time spent in each function including the time spent in the function's children. The third column shows how often the function was called to serve 100 requests to the main page.
This figure shows how much time is spent in each function when page caching is disabled. The functions are sorted by the 'Self' column, which shows the time spent in each function without the time spent in its children. The second column shows how often the function was called to serve 100 requests to the main page.
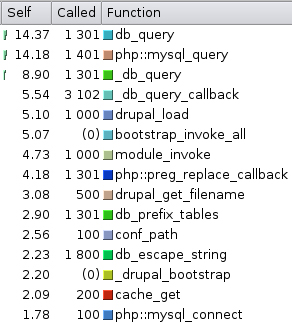
This figure shows how much time is spent in each function when page caching is enabled. The functions are sorted by the 'Self' column, which shows the time spent in each function without the time spent in its children. The second column shows how often the function was called to serve 100 requests to the main page.
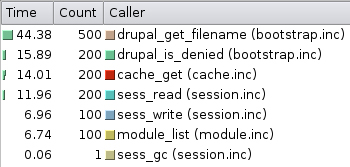
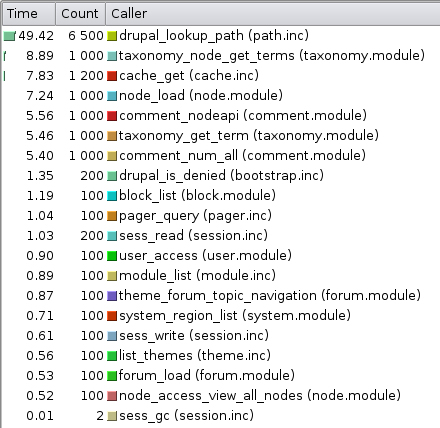
This figure shows the Drupal functions responsible for querying the database when serving 100 cached pages. The first column shows how much time is spent in the calls to db_query(). The second column shows how many times each function queried the database and the last column shows the functions' names and source files.
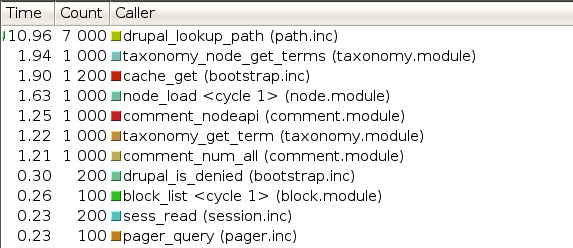
This figure shows the Drupal functions responsible for querying the database when serving 100 pages. The first column shows how much time is spent in the calls to db_query(). The second column shows how many times each function queried the database and the last column shows the functions' names and source files.