Featured
Building my own temperature and humidity monitor
How I created a Champagne and wine monitoring system using open hardware and Drupal as an Internet-of-Things (IoT) backend. Sometimes, more is more!
Contents
Last fall, we toured the Champagne region in France, famous for its sparkling wines. We explored the ancient, underground cellars where Champagne undergoes its magical transformation from grape juice to sparkling wine. These cellars, often 30 meters deep and kilometers long, maintain a constant temperature of around 10-12°C, providing the perfect conditions for aging and storing Champagne.

After sampling various Champagnes, we returned home with eight cases to store in our home's basement. However, unlike those deep cellars, our basement is just a few meters deep, prompting a simple question that sent me down a rabbit hole: how does our basement's temperature compare?
Rather than just buying a thermometer, I decided to build my own "temperature monitoring system" using open hardware and custom-built software. After all, who needs a simple solution when you can spend evenings tinkering with hardware, sensors, wires and writing your own software? Sometimes, more is more!
The basic idea is this: track the temperature and humidity of our basement every 15 minutes and send this information to a web service. This web service analyzes the data and alerts us if our basement becomes too cold or warm.
I launched this monitoring system around Christmas last year, so it's been running for nearly three months now. You can view the live temperature and historical data trends at https://dri.es/sensors. Yes, publishing our basement's temperature online is a bit quirky, but it's all in good fun.
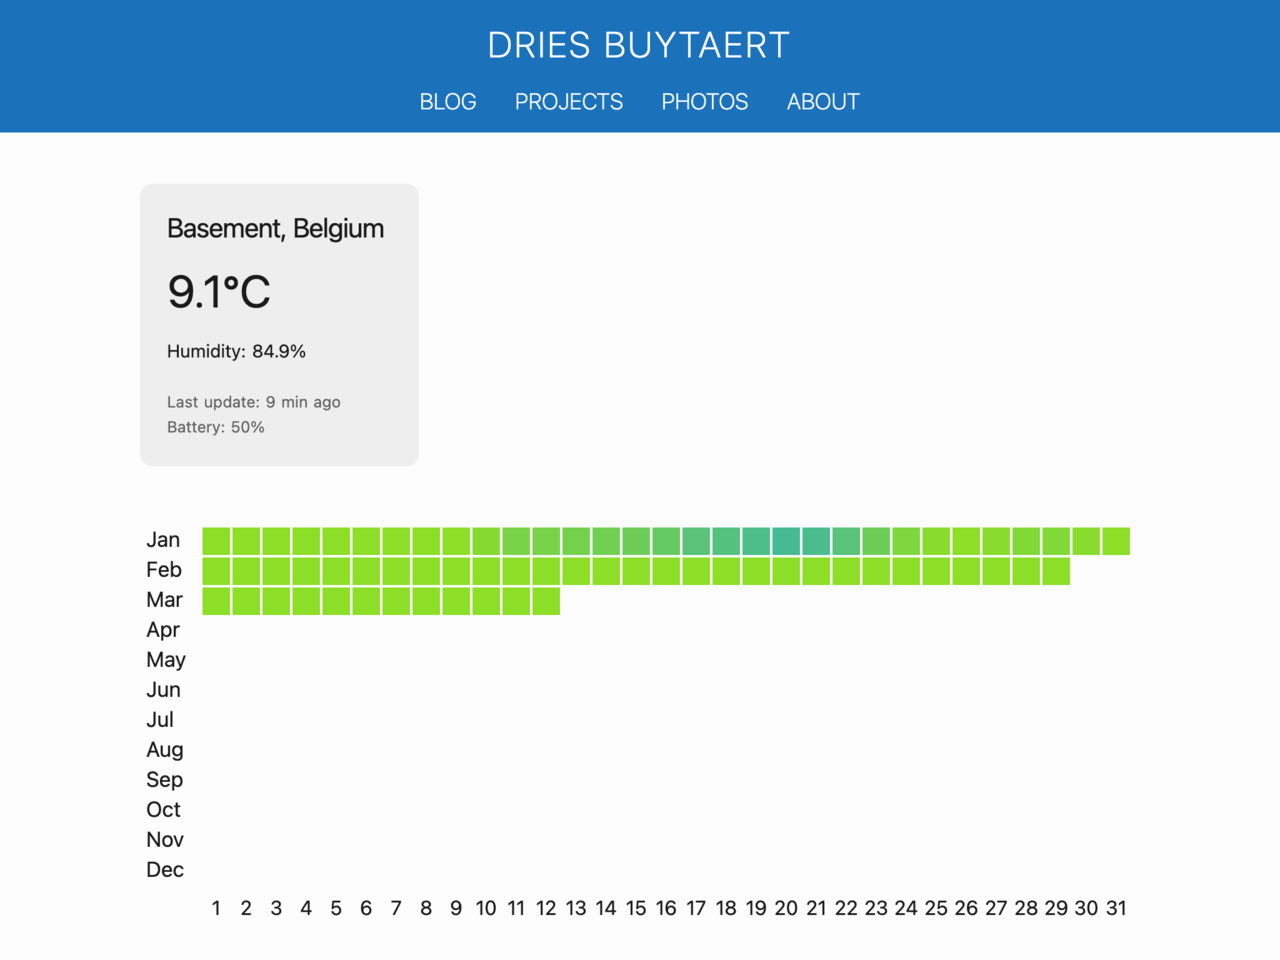
So far, the temperature in our basement has been ideal for storing wine. However, I expect it will change during the summer months.
In the rest of this blog post, I'll share how I built the client that collects and sends the data, as well as the web service backend that processes and visualizes that data.
§Hardware used
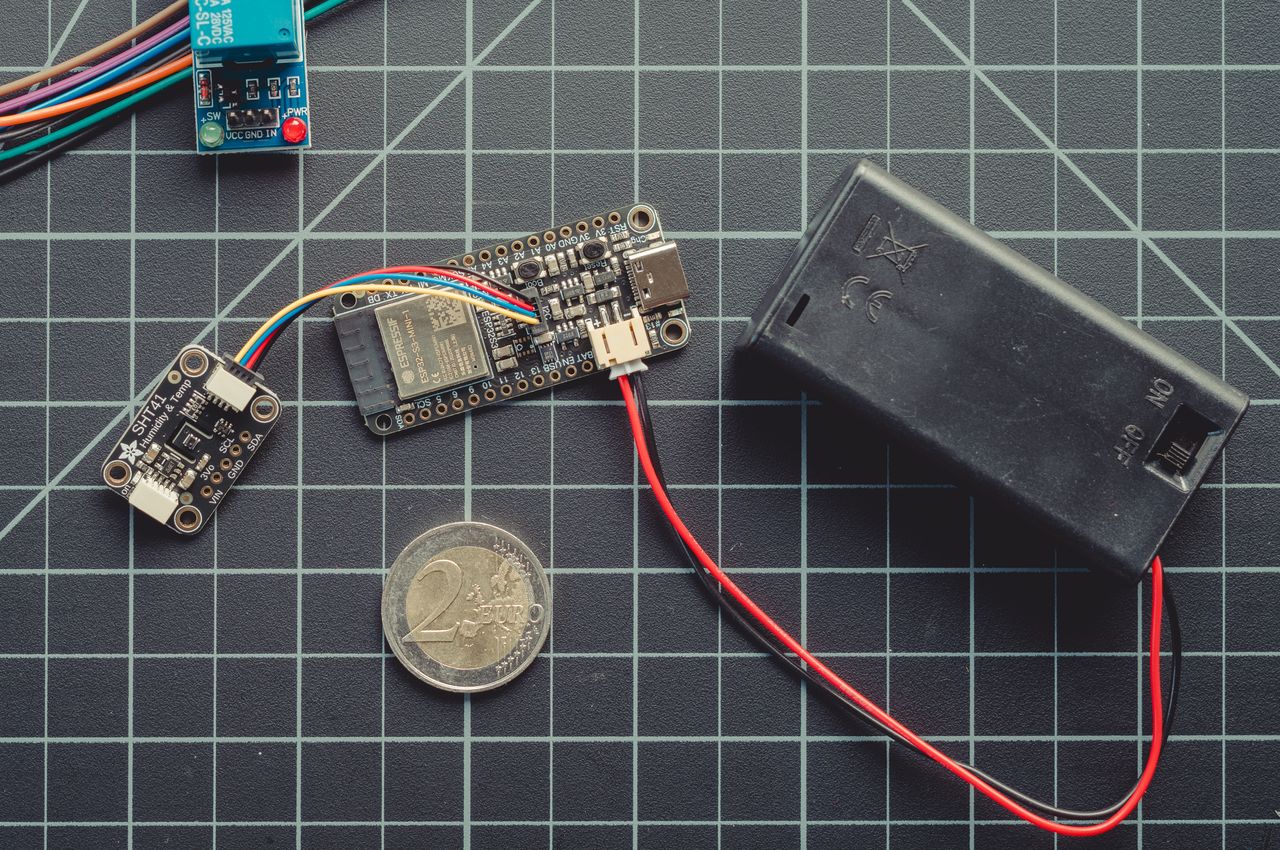
For this project, I bought:
- Adafruit ESP32-S3 Feather: A microcontroller board with Wi-Fi and Bluetooth capabilities, serving as the central processing unit of my project.
- Adafruit SHT4x sensor: A high-accuracy temperature and humidity sensor.
- 3.7v 500mAh battery: A small and portable power source.
- STEMMA QT / Qwiic JST SH 4-pin cable: To connect the sensor to the board without soldering.
The total hardware cost was $32.35 USD. I like Adafruit a lot, but it's worth noting that their products often come at a higher cost. You can find comparable hardware for as little as $10-15 elsewhere. Adafruit's premium cost is understandable, considering how much valuable content they create for the maker community.
§Client code for Adafruit ESP32-S3 Feather
I developed the client code for the Adafruit ESP32-S3 Feather using the Arduino IDE, a widely used platform for developing and uploading code to Arduino-compatible boards.
The code measures temperature and humidity every 15 minutes, connects to WiFi, and sends this data to https://dri.es/sensors, my web service endpoint.
One of my goals was to create a system that could operate for a long time without needing to recharge the battery. The ESP32-S3 supports a "deep sleep" mode where it powers down almost all its functions, except for the clock and memory. By placing the ESP32-S3 into deep sleep mode between measurements, I was able to significantly reduce power.
Now that you understand the high-level design goals, including deep sleep mode, I'll share the complete client code below. It includes detailed code comments, making it self-explanatory.
#include "Adafruit_SHT4x.h"
#include "Adafruit_MAX1704X.h"
#include "WiFiManager.h"
#include "ArduinoJson.h"
#include "HTTPClient.h"

// The Adafruit_SHT4x sensor is a high-precision, temperature and humidity
// sensor with an I2C interface.
Adafruit_SHT4x sht4 = Adafruit_SHT4x();

// The Adafruit ESP32-S3 Feather comes with a built-in MAX17048 LiPoly / LiIon
// battery monitor. The MAX17048 provides accurate monitoring of the battery's
// voltage. Utilizing the Adafruit library, not only helps us obtain the raw
// voltage data from the battery cell, but also converts this data into a more
// intuitive battery percentage or charge level. We will pass on the battery
// percentage to the web service endpoint, which can visualize it or use it to
// send notifications when the battery needs recharging.
Adafruit_MAX17048 maxlipo;

// The setup() function is used to initialize the device's hardware and
// communications. It's executed once at startup. Here, we begin serial
// communication, initialize sensors, connect to Wi-Fi, and send initial
// data.
void setup() {
  Serial.begin(115200);

  // Wait for the serial connection to establish before proceeding further.
  // This is crucial for boards with native USB interfaces. Without this loop,
  // initial output sent to the serial monitor is lost. This code is not
  // needed when running on battery.
  //delay(1000);

  // Generates a unique device ID from a segment of the MAC address.
  // Since the MAC address is permanent and unchanged after reboots,
  // this guarantees the device ID remains consistent. To achieve a
  // compact ID, only a specific portion of the MAC address is used,
  // specifically the range between 0x10000 and 0xFFFFF. This range
  // translates to a hexadecimal string of a fixed 5-character length,
  // giving us roughly 1 million unique IDs. This approach balances
  // uniqueness with compactness.
  uint64_t chipid = ESP.getEfuseMac();
  uint32_t deviceValue = ((uint32_t)(chipid >> 16) & 0x0FFFFF) | 0x10000;
  char device[6]; // 5 characters for the hex representation + the null terminator.
  sprintf(device, "%x", deviceValue); // Use '%x' for lowercase hex letters

  // Initialize the SHT4x sensor:
  if (sht4.begin()) {
  Serial.println(F("SHT4 temperature and humidity sensor initialized."));
  sht4.setPrecision(SHT4X_HIGH_PRECISION);
  sht4.setHeater(SHT4X_NO_HEATER);
  }
  else {
  Serial.println(F("Could not find SHT4 sensor."));
  }

  // Initialize the MAX17048 sensor:
  if (maxlipo.begin()) {
  Serial.println(F("MAX17048 battery monitor initialized."));
  }
  else {
  Serial.println(F("Could not find MAX17048 battery monitor!"));
  }

  // Insert a short delay to ensure the sensors are ready and their data is stable:
  delay(200);

  // Retrieve temperature and humidity data from SHT4 sensor:
  sensors_event_t humidity, temp;
  sht4.getEvent(&humidity, &temp);

  // Get the battery percentage and calibrate if it's over 100%:
  float batteryPercent = maxlipo.cellPercent();
  batteryPercent = (batteryPercent > 100) ? 100 : batteryPercent;

  WiFiManager wifiManager;

  // Uncomment the following line to erase all saved WiFi credentials.
  // This can be useful for debugging or reconfiguration purposes.
  // wifiManager.resetSettings();

  // This WiFi manager attempts to establish a WiFi connection using known
  // credentials, stored in RAM. If it fails, the device will switch to Access
  // Point mode, creating a network named "Temperature Monitor". In this mode,
  // connect to this network, navigate to the device's IP address (default IP
  // is 192.168.4.1) using a web browser, and a configuration portal will be
  // presented, allowing you to enter new WiFi credentials. Upon submission,
  // the device will reboot and try connecting to the specified network with
  // these new credentials.
  if (!wifiManager.autoConnect("Temperature Monitor")) {
  Serial.println(F("Failed to connect to WiFi ..."));

  // If the device fails to connect to WiFi, it will restart to try again.
  // This approach is useful for handling temporary network issues. However,
  // in scenarios where the network is persistently unavailable (e.g. router
  // down for more than an hour, consistently poor signal), the repeated
  // restarts and WiFi connection attempts can quickly drain the battery.
  ESP.restart();

  // Mandatory delay to allow the restart process to initiate properly:
  delay(1000);
  }

  // Send collected data as JSON to the specified URL:
  sendJsonData("https://dri.es/sensors", device, temp.temperature, humidity.relative_humidity, batteryPercent);

  // WiFi consumes significant power so turn it off when done:
  WiFi.disconnect(true);

  // Enter deep sleep for 15 minutes. The ESP32-S3's deep sleep mode minimizes
  // power consumption by powering down most components, except the RTC. This
  // mode is efficient for battery-powered projects where constant operation
  // isn't needed. When the device wakes up after the set period, it runs
  // setup() again, as the state  isn't preserved.
  Serial.println(F("Going to sleep for 15 minutes ..."));
  ESP.deepSleep(15 * 60 * 1000000); // 15 mins * 60 secs/min * 1,000,000 μs/sec.
}

bool sendJsonData(const char* url, const char* device, float temperature, float humidity, float battery) {
  StaticJsonDocument<200> doc;

  // Round floating-point values to one decimal place for efficient data
  // transmission. This approach reduces the JSON payload size, which is
  // important for IoT applications running on batteries.
  doc["device"] = device;
  doc["temperature"] = String(temperature, 1);
  doc["humidity"] = String(humidity, 1);
  doc["battery"] = String(battery, 1);

  // Serialize JSON to a string:
  String jsonData;
  serializeJson(doc, jsonData);

  // Initialize an HTTP client with the provided URL:
  HTTPClient httpClient;
  httpClient.begin(url);
  httpClient.addHeader("Content-Type", "application/json");

  // Send a HTTP POST request:
  int httpCode = httpClient.POST(jsonData);

  // Close the HTTP connection:
  httpClient.end();

  // Print debug information to the serial console:
  Serial.println("Sent '" + jsonData + "' to " + String(url) + ", return code " + httpCode);
  return (httpCode == 200);
}

void loop() {
  // The ESP32-S3 resets and runs setup() after waking up from deep sleep,
  // making this continuous loop unnecessary.
}
§Further optimizing battery usage
When I launched my thermometer around Christmas 2023, the battery was at 88%. Today, it is at 52%. Some quick math suggests it's using approximately 12% of its battery per month. Given its current rate of usage, it needs recharging about every 8 months.
Connecting to the WiFi and sending data are by far the main power drains. To extend the battery life, I could send updates less frequently than every 15 minutes, only send them when there is a change in temperature (which is often unchanged or only different by 0.1°C), or send batches of data points together. Any of these methods would work for my needs, but I haven't implemented them yet.
Alternatively, I could hook the microcontroller up to a 5V power adapter, but where is the fun in that? It goes against the project's "more is more" principle.
§Handling web service requests
With the client code running on the ESP32-S3 and sending sensor data to https://dri.es/sensors, the next step is to set up a web service endpoint to receive this incoming data.
As I use Drupal for my website, I implemented the web service endpoint in Drupal. Drupal uses Symfony, a popular PHP framework, for large parts of its architecture. This combination offers an easy but powerful way for implementing web services, similar to those found across other modern server-side web development frameworks like Laravel, Django, etc.
Here is what my Drupal routing configuration looks like:
sensors.sensor_data:
  path: '/sensors'
  methods: [POST]
  defaults:
  _controller: '\Drupal\sensors\Controller\SensorMonitorController::postSensorData'
  requirements:
  _access: 'TRUE'
The above configuration directs Drupal to send POST requests made to https://dri.es/sensors to the postSensorData() method of the SensorMonitorController class.
The implementation of this method handles request authentication, validates the JSON payload, and saves the data to a MariaDB database table. Pseudo-code:
public function postSensorData(Request $request) : JsonResponse {
  $content = $request->getContent();
  $data = json_decode($content, TRUE);

  // Validate the JSON payload:
  ...

  // Authenticate the request:
  ...

  $device = DeviceFactory::getDevice($data['device']);
  if ($device) {
  $device->recordSensorEvent($data);
  }

  return new JsonResponse(['message' => 'Thank you!']);
 }
For testing your web service, you can use tools like cURL:
$ curl -X POST -H "Content-Type: application/json" -d '{"device":"0xdb123", "temperature":21.5, "humidity":42.5, "battery":90.0}' https://localhost/sensors
While cURL is great for quick tests, I use PHPUnit tests for automated testing in my CI/CD workflow. This ensures that everything keeps working, even when upgrading Drupal, Symfony, or other components of my stack.
§Storing sensor data in a database
The primary purpose of $device->recordSensorEvent() in SensorMonitorController::postSensorData() is to store sensor data into a SQL database. So, let's delve into the database design.
My main design goals for the database backend were:
- Instead of storing every data point indefinitely, only keep the daily average, minimum, maximum, and the latest readings for each sensor type across all devices.
- Make it easy to add new devices and new sensors in the future. For instance, if I decide to add a CO2 sensor for our bedroom one day (a decision made in my head but not yet pitched to my better half), I want that to be easy.
To this end, I created the following MariaDB table:
CREATE TABLE sensor_data (
  date DATE,
  device VARCHAR(255),
  sensor VARCHAR(255),
  avg_value DECIMAL(5,1),
  min_value DECIMAL(5,1),
  max_value DECIMAL(5,1),
  min_timestamp DATETIME,
  max_timestamp DATETIME,
  readings SMALLINT NOT NULL,
  UNIQUE KEY unique_stat (date, device, sensor)
);
A brief explanation for each field:
date: The date for each sensor reading. It doesn't include a time component as we aggregate data on a daily basis.device: The device ID of the device providing the sensor data, such as 'basement' or 'bedroom'.sensor: The type of sensor, such as 'temperature', 'humidity' or 'co2'.avg_value: The average value of the sensor readings for the day. Since individual readings are not stored, a rolling average is calculated and updated with each new reading using the formula: . This method can accumulate minor rounding errors, but simulations show these are negligible for this use case.min_valueandmax_value: The daily minimum and maximum sensor readings.min_timestampandmax_timestamp: The exact moments when the minimum and maximum values for that day were recorded.readings: The number of readings (or measurements) taken throughout the day, which is used for calculating the rolling average.
In essence, the recordSensorEvent() method needs to determine if a record already exists for the current date. Depending on this determination, it will either insert a new record or update the existing one.
In Drupal this process is streamlined with the merge() function in Drupal's database layer. This function handles both inserting new data and updating existing data in one step.
private function updateDailySensorEvent(string $sensor, float $value): void {
  $timestamp = \Drupal::time()->getRequestTime();
  $date = date('Y-m-d', $timestamp);
  $datetime = date('Y-m-d H:i:s', $timestamp);

  $connection = Database::getConnection();

  $result = $connection->merge('sensor_data')
  ->keys([
   'device' => $this->id,
   'sensor' => $sensor,
   'date' => $date,
  ])
  ->fields([
   'avg_value' => $value,
   'min_value' => $value,
   'max_value' => $value,
   'min_timestamp' => $datetime,
   'max_timestamp' => $datetime,
   'readings' => 1,
  ])
  ->expression('avg_value', 'avg_value + ((:new_value - avg_value) / (readings + 1))', [':new_value' => $value])
  ->expression('min_value', 'LEAST(min_value, :value)', [':value' => $value])
  ->expression('max_value', 'GREATEST(max_value, :value)', [':value' => $value])
  ->expression('min_timestamp', 'IF(LEAST(min_value, :value) = :value, :timestamp, min_timestamp)', [':value' => $value, ':timestamp' => $datetime])
  ->expression('max_timestamp', 'IF(GREATEST(max_value, :value) = :value, :timestamp, max_timestamp)', [':value' => $value, ':timestamp' => $datetime])
  ->expression('readings', 'readings + 1')
  ->execute();
 }
Here is what the query does:
- It checks if a record for the current sensor and date exists.
- If not, it creates a new record with the sensor data, including the initial average, minimum, maximum, and latest value readings, along with the timestamp for these values.
- If a record does exist, it updates the record with the new sensor data, adjusting the average value, and updating minimum and maximum values and their timestamps if the new reading is a new minimum or maximum.
- The function also increments the count of readings.
For those not using Drupal, similar functionality can be achieved with MariaDB's 1 command, which allows for the same conditional insert or update logic based on whether the specified unique key already exists in the table.
Here are example queries, extracted from MariaDB's General Query Log to help you get started:
INSERT INTO sensor_data (device, sensor, date, min_value, min_timestamp, max_value, max_timestamp, readings)
VALUES ('0xdb123', 'temperature', '2024-01-01', 21, '2024-01-01 00:00:00', 21, '2024-01-01 00:00:00', 1);

UPDATE sensor_data
SET min_value = LEAST(min_value, 21),
  min_timestamp = IF(LEAST(min_value, 21) = 21, '2024-01-01 00:00:00', min_timestamp),
  max_value = GREATEST(max_value, 21),
  max_timestamp = IF(GREATEST(max_value, 21) = 21, '2024-01-01 00:00:00', max_timestamp),
  readings = readings + 1
WHERE device = '0xdb123' AND sensor = 'temperature' AND date = '2024-01-01';
§Generating graphs
With the data securely stored in the database, the next step involved generating the graphs. To accomplish this, I wrote some custom PHP code that generates Scalable Vector Graphics (SVGs).
Given that is blog post is already quite long, I'll spare you the details. For now, those curious can use the 'View source' feature in their web browser to examine the SVGs on the thermometer page.
§Conclusion
It's fun how a visit to the Champagne cellars in France sparked an unexpected project. Choosing to build a thermometer rather than buying one allowed me to dive back into an old passion for hardware and low-level software.
I also like taking control of my own data and software. It gives me a sense of control and creativity.
As Drupal's project lead, using Drupal for an Internet-of-Things (IoT) backend brought me unexpected joy. I just love the power and flexibility of open-source platforms like Drupal.
As a next step, I hope to design and 3D print a case for my thermometer, something I've never done before. And as mentioned, I'm also considering integrating additional sensors. Stay tuned for updates!
Join 5,000+ readers. I'm the creator of Drupal and co-founder of Acquia. I write about Open Source, AI, and the future of the web, with a focus on building, scaling, and thinking long-term.